


US Dollar, Euro, Australian Dollar Vs Japanese Yen – Price Setup:
- USD/JPY gains appear to be slowing ahead of stiff resistance.
- EUR/JPY has maintained a slight upward bias, while AUD/JPY is flirting with a tough barrier.
- What is the outlook and key level to watch?

Atlanta Federal Reserve President Raphael Bostic’s “slow and steady” remarks appear to have stalled USD/JPY’s rise for now. Bostic echoed a few other Fed officials’ recent remarks that rate-setters may not revisit the jumbo rate hikes of 2022 despite the recent strong US data. In this regard, US monthly jobs and consumer prices data due in the coming days would be key. Also, Fed Chair Powell is due to speak next week at a semi-annual testimony.
USD/JPY 240-minute Chart
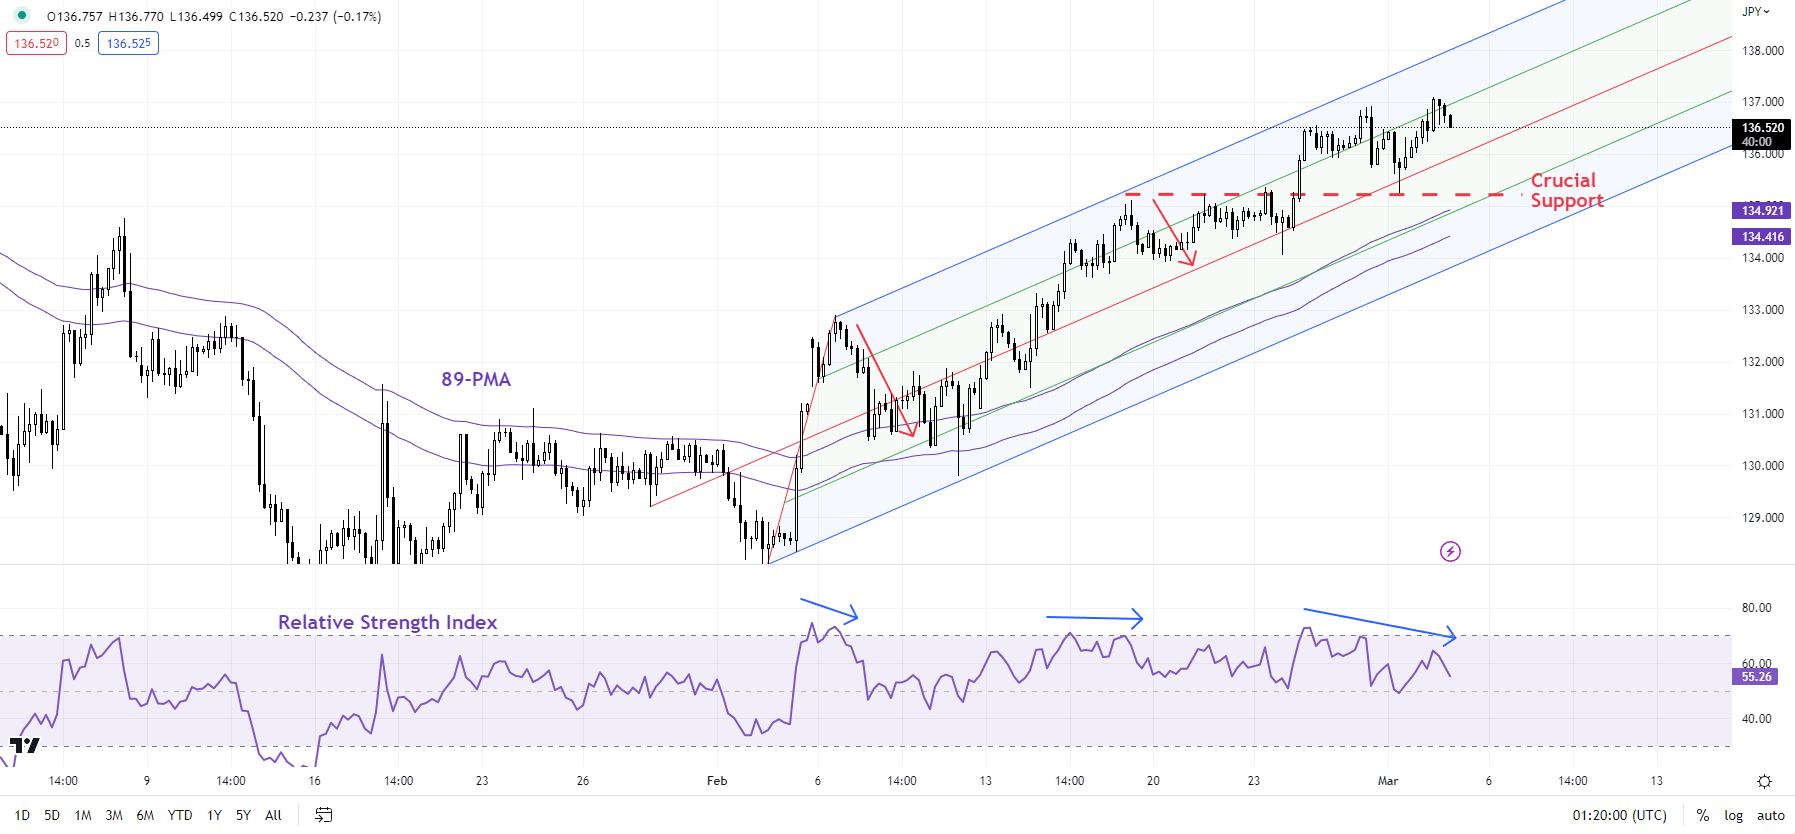
Chart Created Using TradingView
The Japanese yen weakened on Thursday after the US Treasury 2-year yield rose to a fresh 15-year high and the US Treasury 10-year yield rose to a four-month high – a reflection of strong US data in recent weeks. US Rate futures are now pricing in the Fed’s target rate to peak around 5.45% in September from the current 4.50-4.75%, compared with under 5% at the end of January. What are the charts saying?
USD/JPY – Rally showing signs of fatigue?
There are tentative signs emerging that USD/JPY’s six-week-long rally is beginning to lose steam as it tests a tough resistance area at 135.00-138.00, including the early-January high, the 200-day moving average, coinciding with the upper edge of the Ichimoku cloud on the daily charts, not too far from the December high of 138.20. For more discussion on the topic see “Japanese Yen Forecast: High Bar for USD/JPY to Crack Resistance”, published February 26.
USD/JPY Weekly Chart
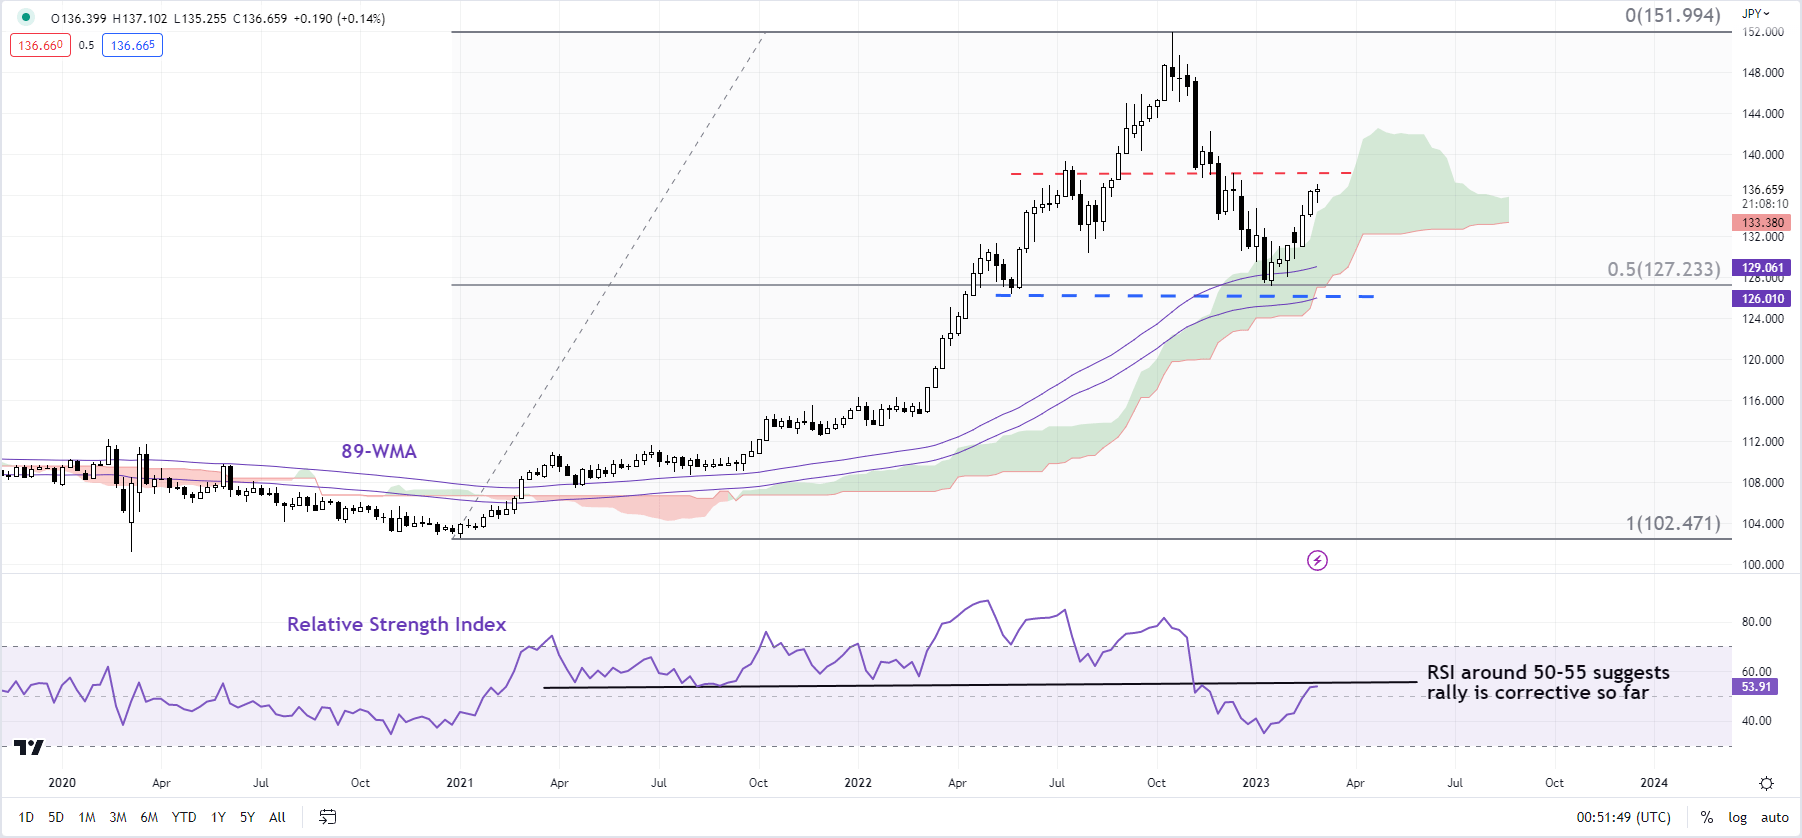
Chart Created Using TradingView
Negative divergence on the 240-minute and daily charts indicates that the rebound is beginning to look tired. To be sure, there is no sign of reversal of the nascent uptrend just yet. USD/JPY would need to break below immediate support on a horizontal trendline from about 135.25 for the short-term upward pressure to fade. Furthermore, any break below 133.75-134.50: including the 89-period moving average on the 240-minute chart, the lower edge of a rising pitchfork channel from January, and the February 24 low, would raise the odds that the short-term uptrend was reversing.
USD/JPY Daily Chart
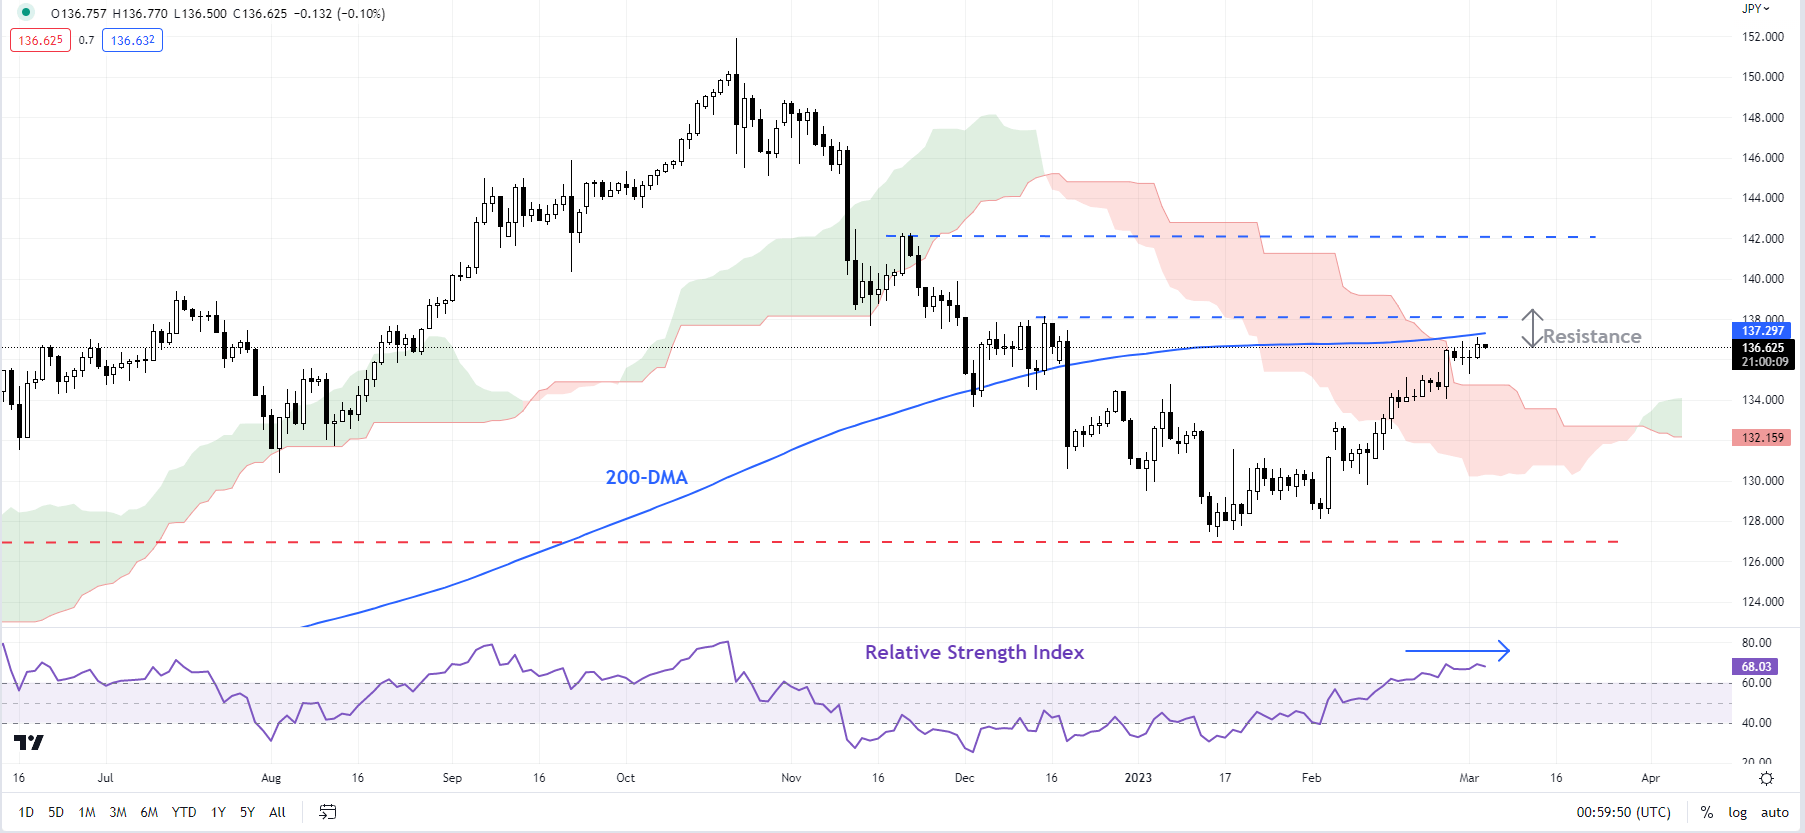
Chart Created Using TradingView
EUR/JPY – Slight upward bias within a broad range
EUR/JPY’s break above a horizontal line from the end of December at about 143.00 triggered a minor double bottom (the January lows) with a potential price objective of 148.00, coinciding with the October high. However, zooming out a bit, EUR/JPY has been in a choppy range since mid-2022, albeit with a gradual upward bias. For the emergence of a material trend, the cross would need to break above the October high of 138.40 or fall below the January low of 137.40.
EUR/JPY Daily Chart
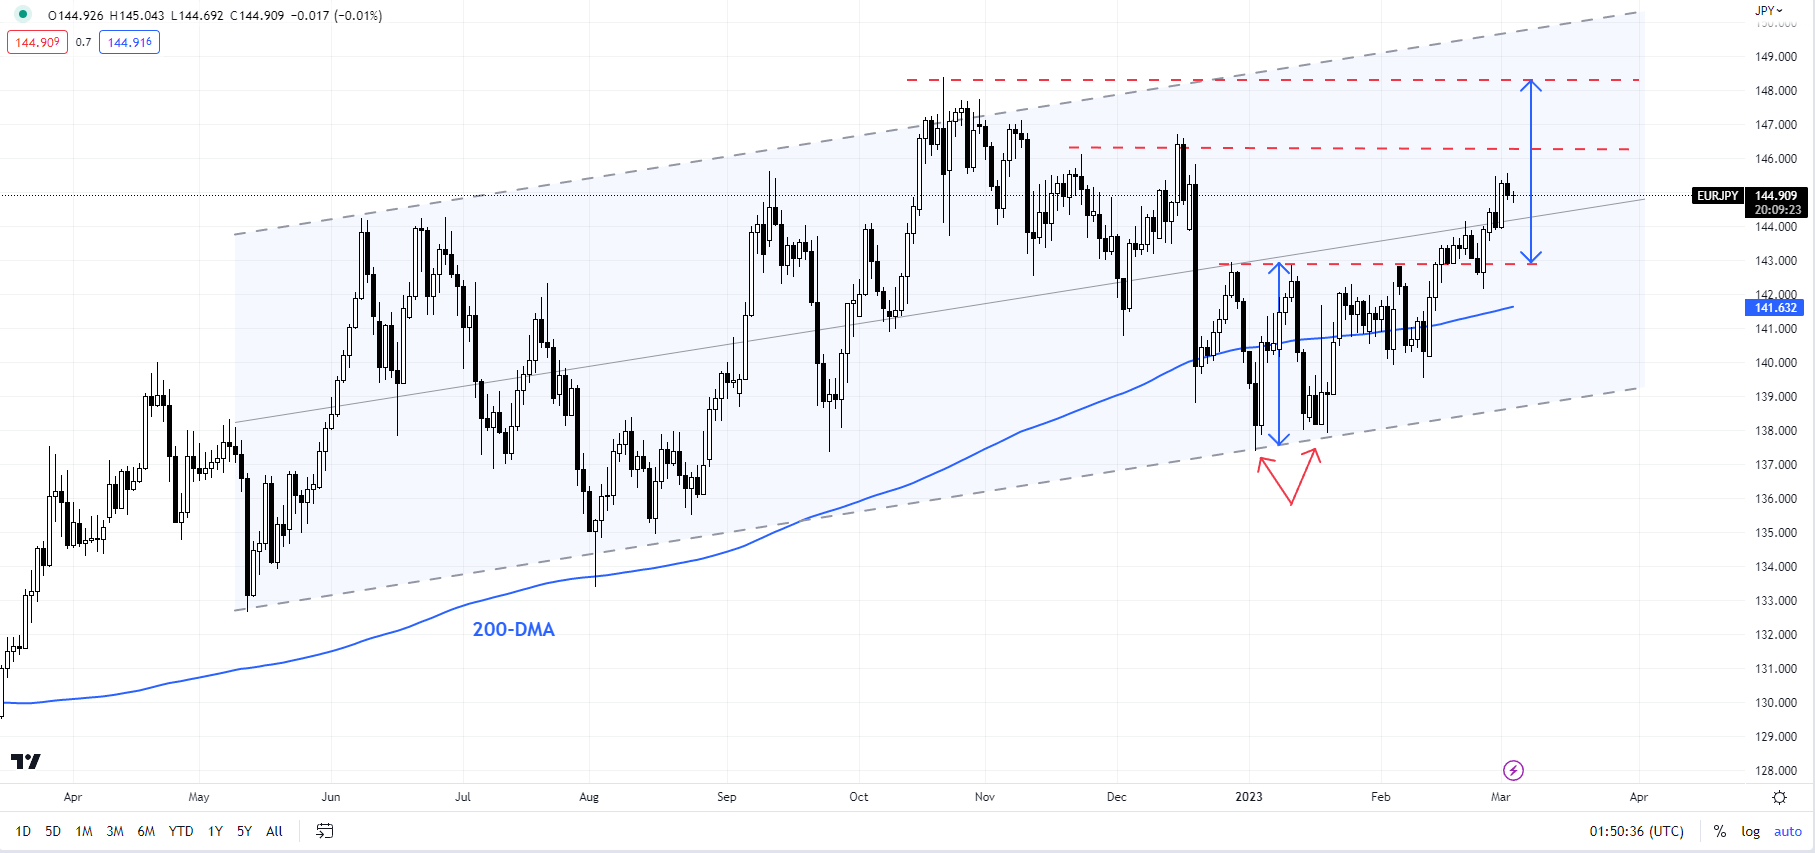
Chart Created Using TradingView
AUD/JPY – Flirts with a tough hurdle
AUD/JPY continues to be snowed under a heavy barrier around 93.00-93.50, including the 200-day moving average, the mid-December high of 93.35, roughly coinciding with the upper edge of a rising channel from December. On the daily charts, the rebound from December looks corrective, that is, the trend is bearish after the cross’ drop in December below a slightly upward-sloping trendline from August triggered a break from a bearish topping pattern. In this regard, AUD/JPY would need to clear the November high of 95.50 for the downward pressure from September to reverse.
AUD/JPY Daily Chart
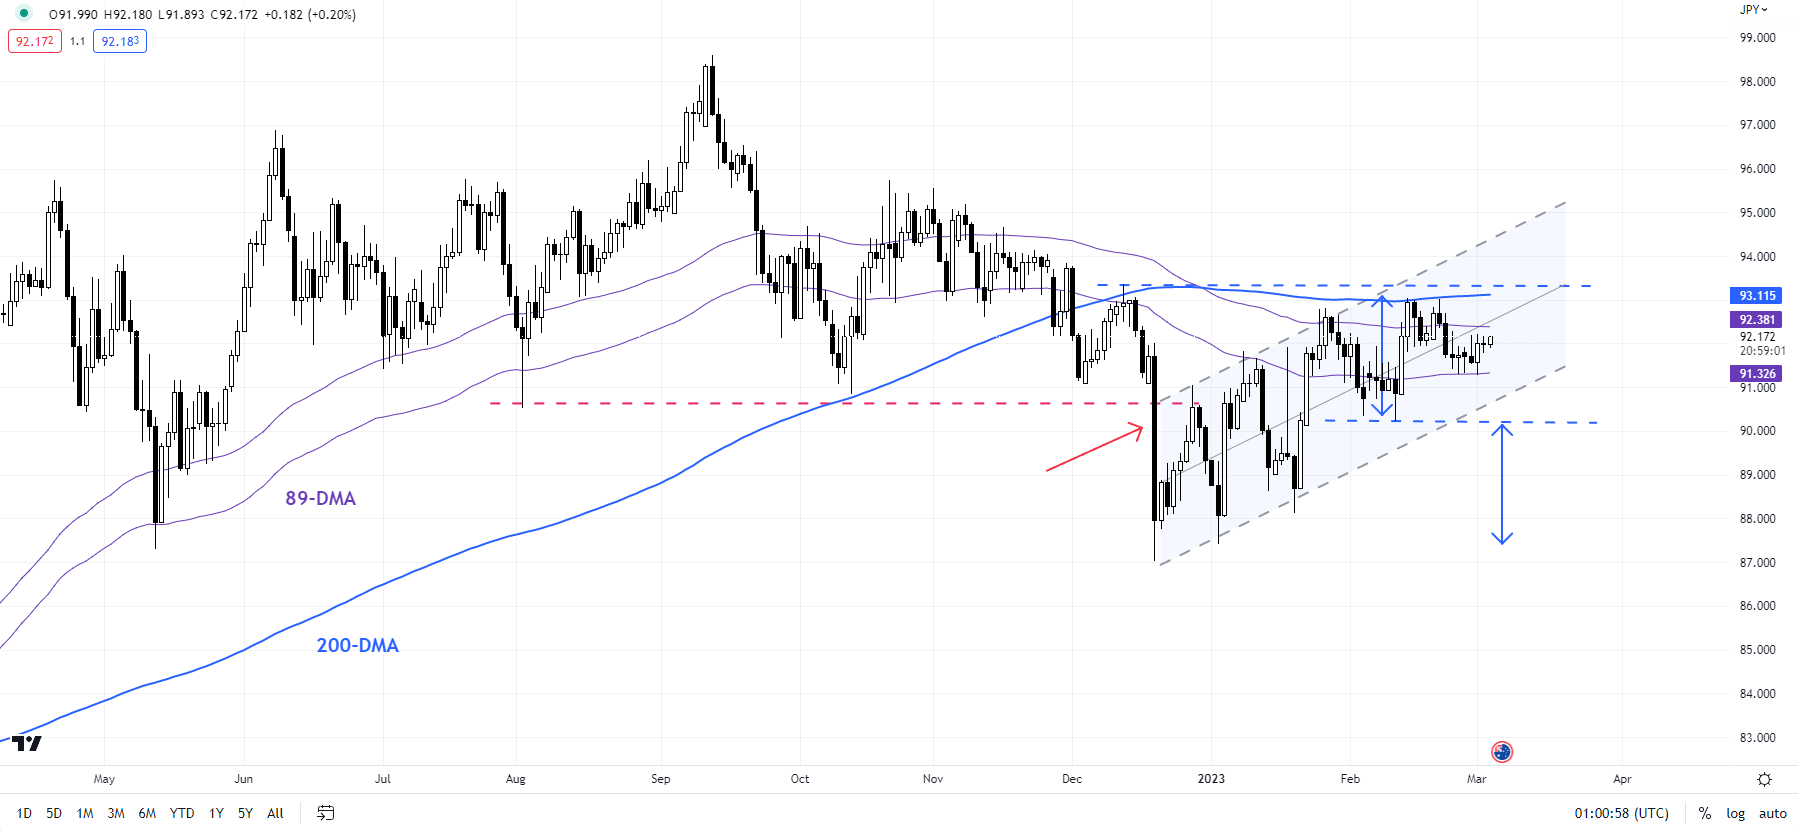
Chart Created Using TradingView
Trade Smarter - Sign up for the DailyFX Newsletter
Receive timely and compelling market commentary from the DailyFX team
--- Written by Manish Jaradi, Strategist for DailyFX.com


