


Gold, XAU/USD - Technical Setup:
- Gold is above quite strong converged support area.
- XAU/USD is now attempting to break a crucial resistance which could expose the upside toward 1876.
- What are the key levels to watch?

Precious metals appear to be holding their last week’s gains on easing US Treasury yields following Atlanta Federal Reserve President Raphael Bostic’s “slow and steady” remarks on Friday. For an extension of the rebound, gold is probably looking for an additional catalyst.
Fed Chair Powell is due to deliver his semi-annual testimony to lawmakers tomorrow and Wednesday. His remarks will be closely watched as financial markets look to reaffirm the recent repricing higher of Fed rate expectations. In his previous appearance a month ago, Powell emphasized the ‘disinflation’ theme and stopped short of adopting an aggressive tone following a blistering US jobs report. A similar undertone could boost XAU/USD. US rate futures are pricing in the Fed’s target rate to peak around 5.44% in September from the current 4.50-4.75%, compared with under 5% at the end of January.
XAU/USD 240-minute Chart
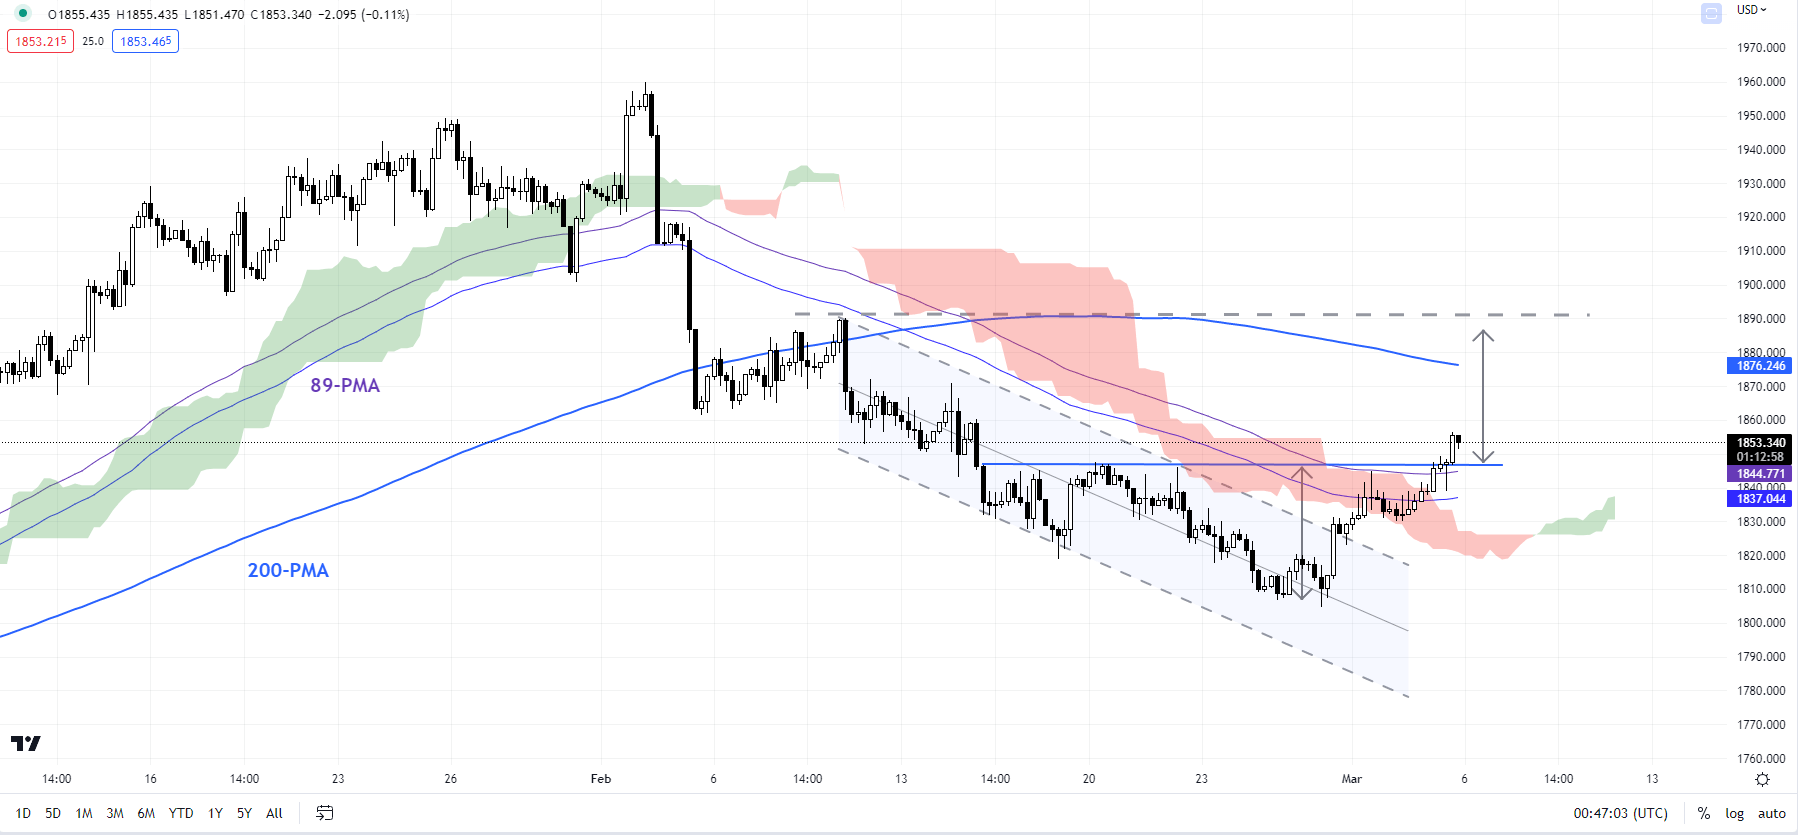
Chart Created Using TradingView
Meanwhile, US payroll growth, due Friday, grew 215000 in February, slower from 443000 in January, while unemployment is expected to hold near the five-decade low of 3.5%. US data has been broadly better than expected since the start of the month, as reflected in the Economic Surprise Index which is around its highest level since April.
XAU/USD Daily Chart
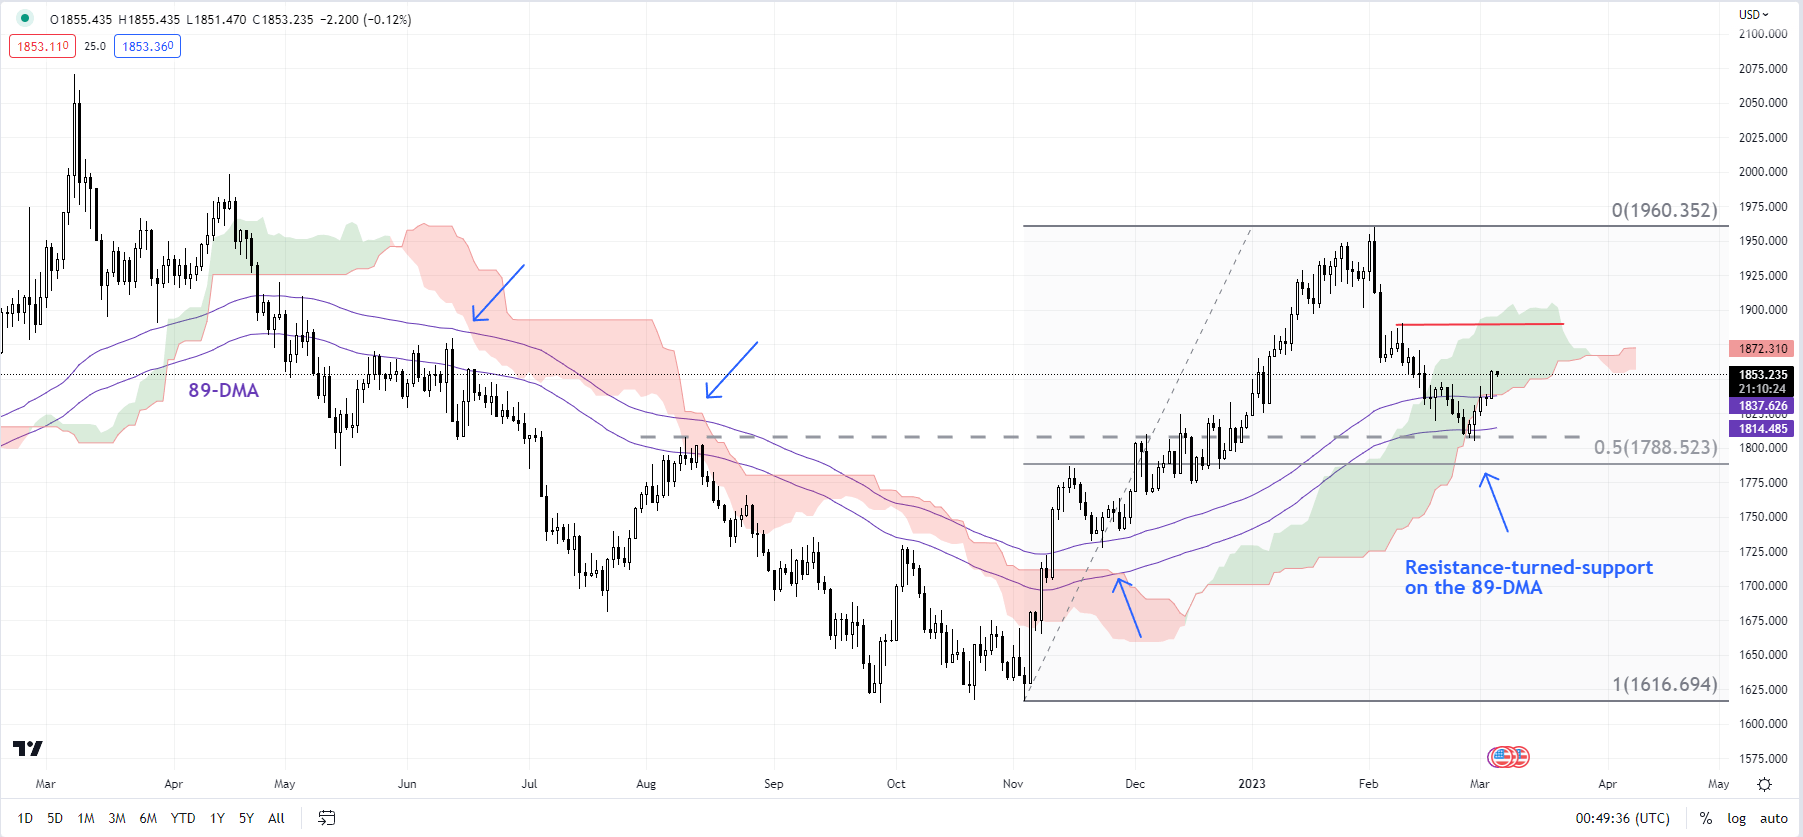
Chart Created Using TradingView
On technical charts, gold is showing tentative signs of setting up an interim low – see “Gold Technical Outlook: A Turnaround on the Cards?”, published March 1. The yellow metal has held a fairly strong converged support area of 1775-1810: the August high of 1807, the lower edge of the Ichimoku cloud support, the 200-day moving average, and the resistance-turned-support on the 89-day moving average (see the daily chart).
Zooming on to shorter timeframes, gold is attempting to break above a vital ceiling on a horizontal trendline from late February at about 1847. Such a break could pave the way toward the 200-period moving average on the 240-minute chart (now at about 1876). However, for the month-long downward pressure to reverse, XAU/USD would need to break above the February 9 high of 1891.
Trade Smarter - Sign up for the DailyFX Newsletter
Receive timely and compelling market commentary from the DailyFX team
--- Written by Manish Jaradi, Strategist for DailyFX.com


