


GBP/USD, BRITISH POUND - Technical Outlook:
- GBP/USD’s spectacular two-month rally could be due for a breather.
- To be sure, there are no signs of reversal just yet.
- What are the signposts to watch?

GBP/USD SHORT-TERM TECHNICAL FORECAST – NEUTRAL
GBP/USD’s spectacular two-month rally could be due for a breather.
GBP/USD is testing a stiff hurdle on the 200-day moving average for the first time since January, not too far from another significant ceiling at the August high of 1.2300. It was last decisively above the long-term moving average in 2021. Hence a break above the converged barrier will have implications for the medium-term outlook. In recent weeks, the odds that GBP/USD’s downtrend has ‘capitulated’ have grown – first highlighted in October with a follow up last weekend.
GBP/USD Daily Chart
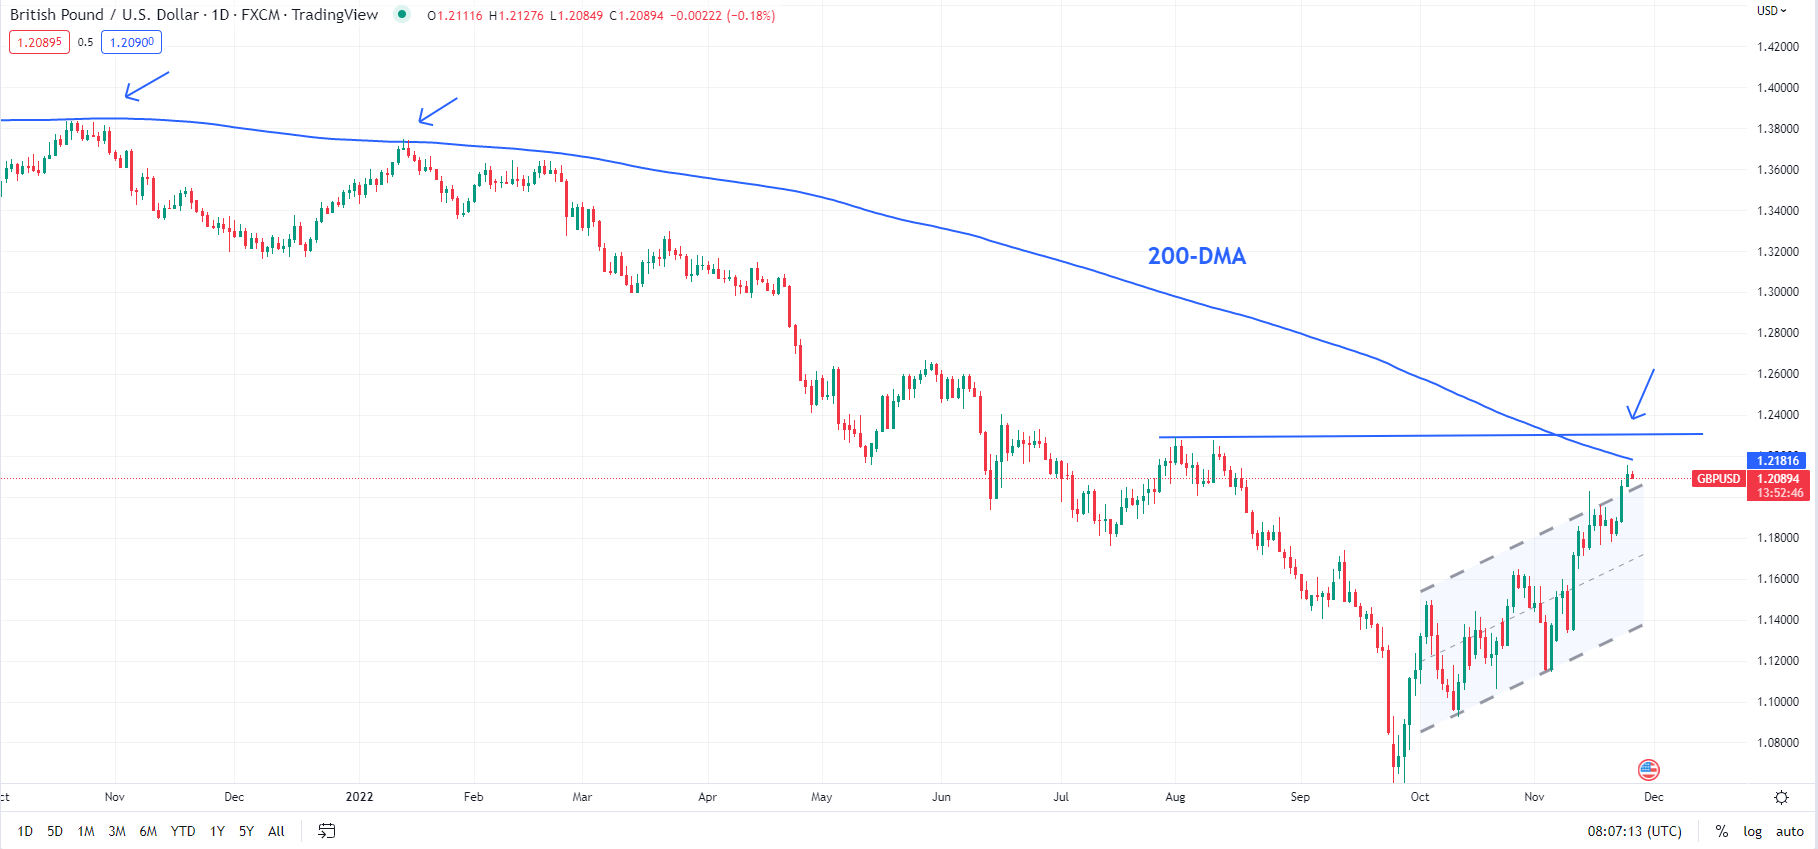
Chart Created Using TradingView
For the moment, the chances are that cable could soon run its course for now. Granted there are no signs of reversal on intraday and higher timeframe charts. However, on intraday charts, there are indications of fatigue – negative divergence on 180-minutes and 240-minute charts (rising price associated with falling/stalling of momentum).
On its own, the formation of a negative divergence is not enough to ensure a turnaround unless accompanied by a price reversal. In this regard, so far GBP/USD continues to make higher highs on a daily basis, implying that the path of least resistance remains up.
GBP/USD 180-minutes Chart
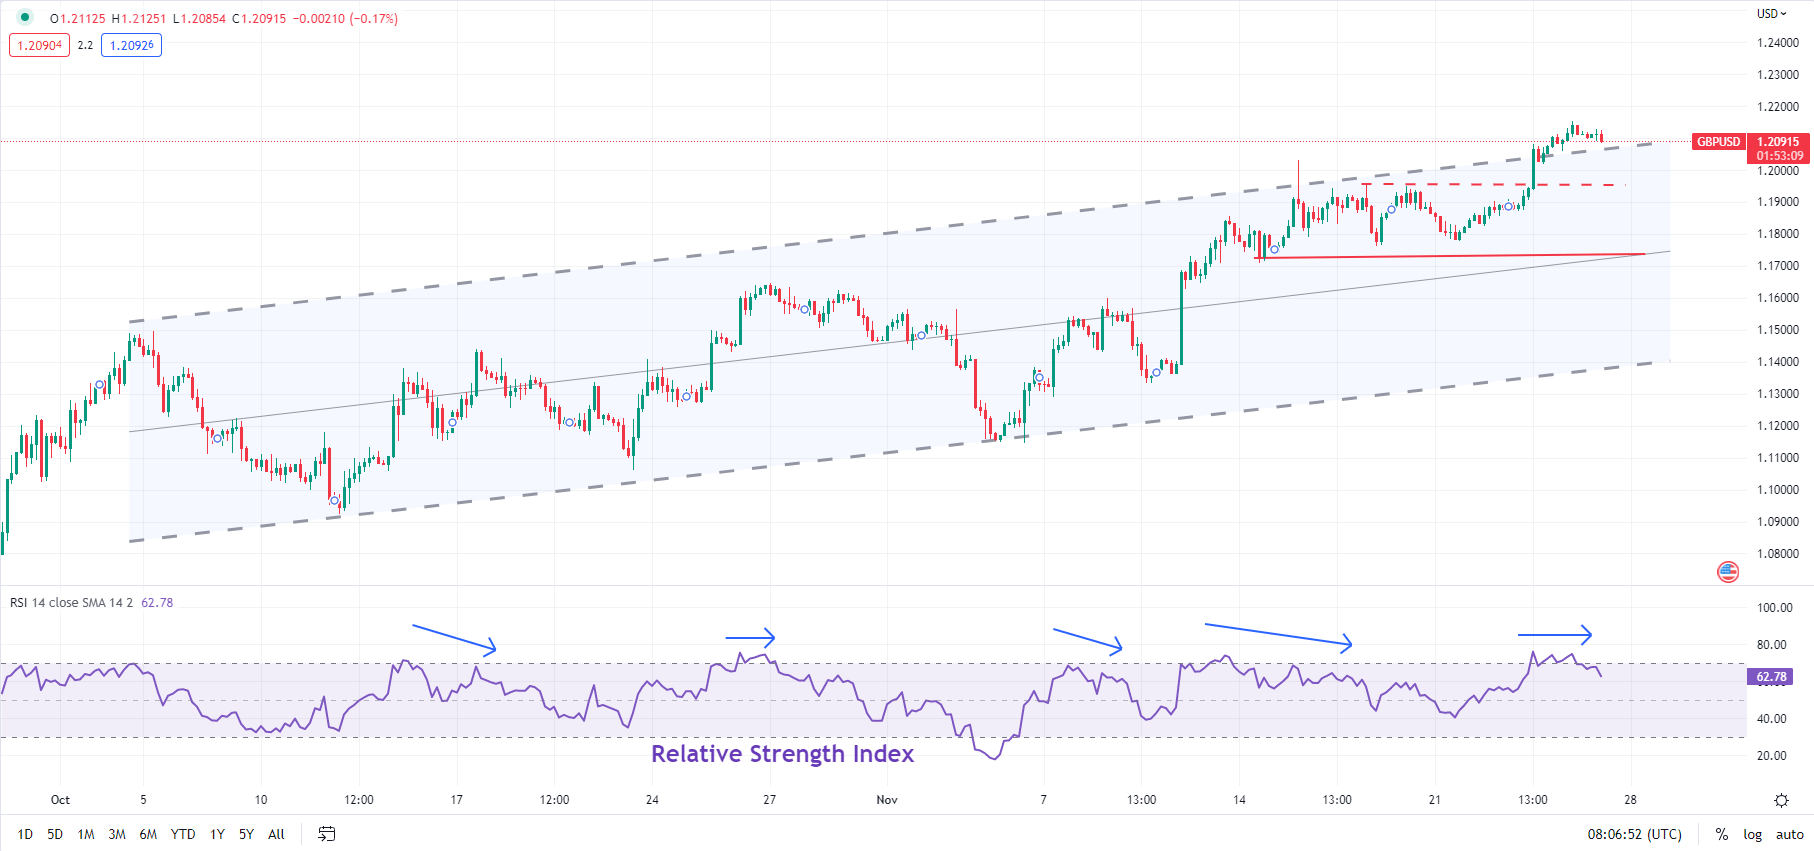
Chart Created Using TradingView
At the very least, the pair needs to first stop making new highs. Once it stops making new highs, the focus would shift to immediate support at the November 18 high of 1.1950. A decisive break below 1.1950 would be the first sign that cracks in the rally are emerging, opening the door toward the November 17 low of 1.1760. A piercing of 1.1760 would confirm that the short-term upward pressure had faded.

--- Written by Manish Jaradi, Strategist for DailyFX.com


