


GBP/USD, BRITISH POUND - Technical Outlook:
- GBP/USD has risen above key resistance at the September high.
- Growing odds that the pair could have set a medium-term low.
- What is the outlook and the signposts to watch?

GBP/USD MEDIUM-TERM TECHNICAL FORECAST – NEUTRAL
The rise above the September high of 1.1740 raises the odds that the worst could well be over for GBP/USD.
Besides valuations, sentiment, positioning, and major long-term support highlighted in October, there are three other reasons why the September low could indeed be a significant floor for GBP/USD. Firstly, the extent of the rebound from early October is the greatest compared with all the corrective rallies since the slide began in mid-2021.
GBP/USD Daily Chart
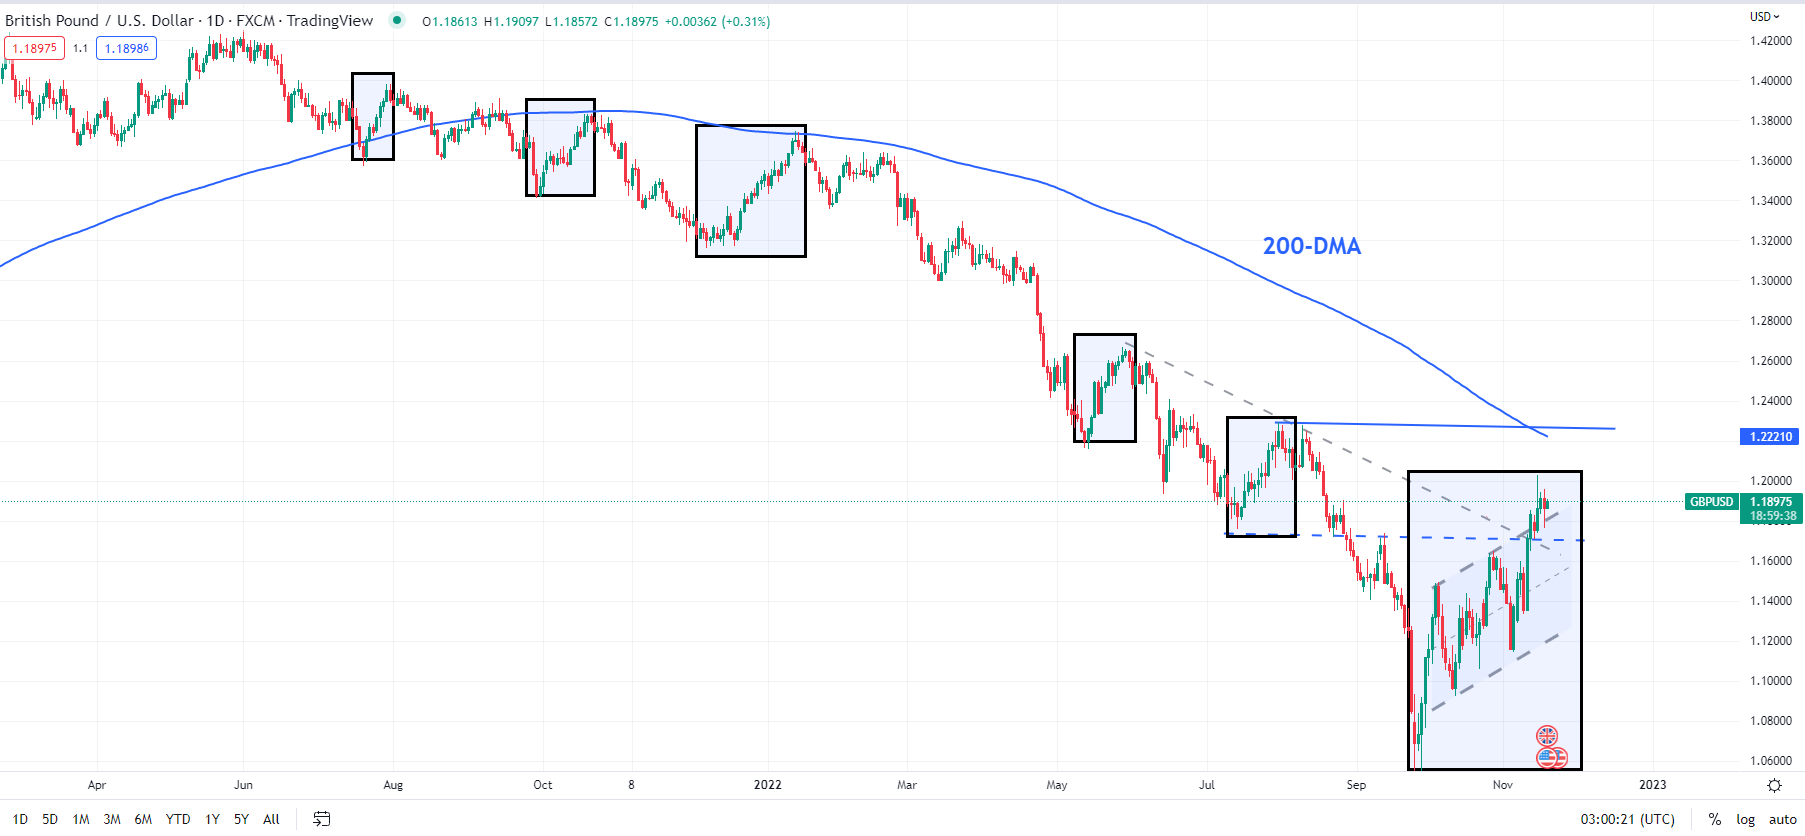
Chart Created Using TradingView
Secondly, the duration of the current rebound has surpassed similar rallies since last year. More often than not, when the extent and the duration of a correction exceed those of the previous corrections, it tends to signify a trend change, at the very least, if not a trend reversal.
Lastly, the rise this month above the September high on the monthly candlestick charts is important. As the monthly chart shows, the September candlestick was the ‘last supply point’. A rise above the final supply zone tends to indicate that bears are exhausted, implying that the path of least resistance is sideways to up in the interim.
GBP/USD Monthly Chart
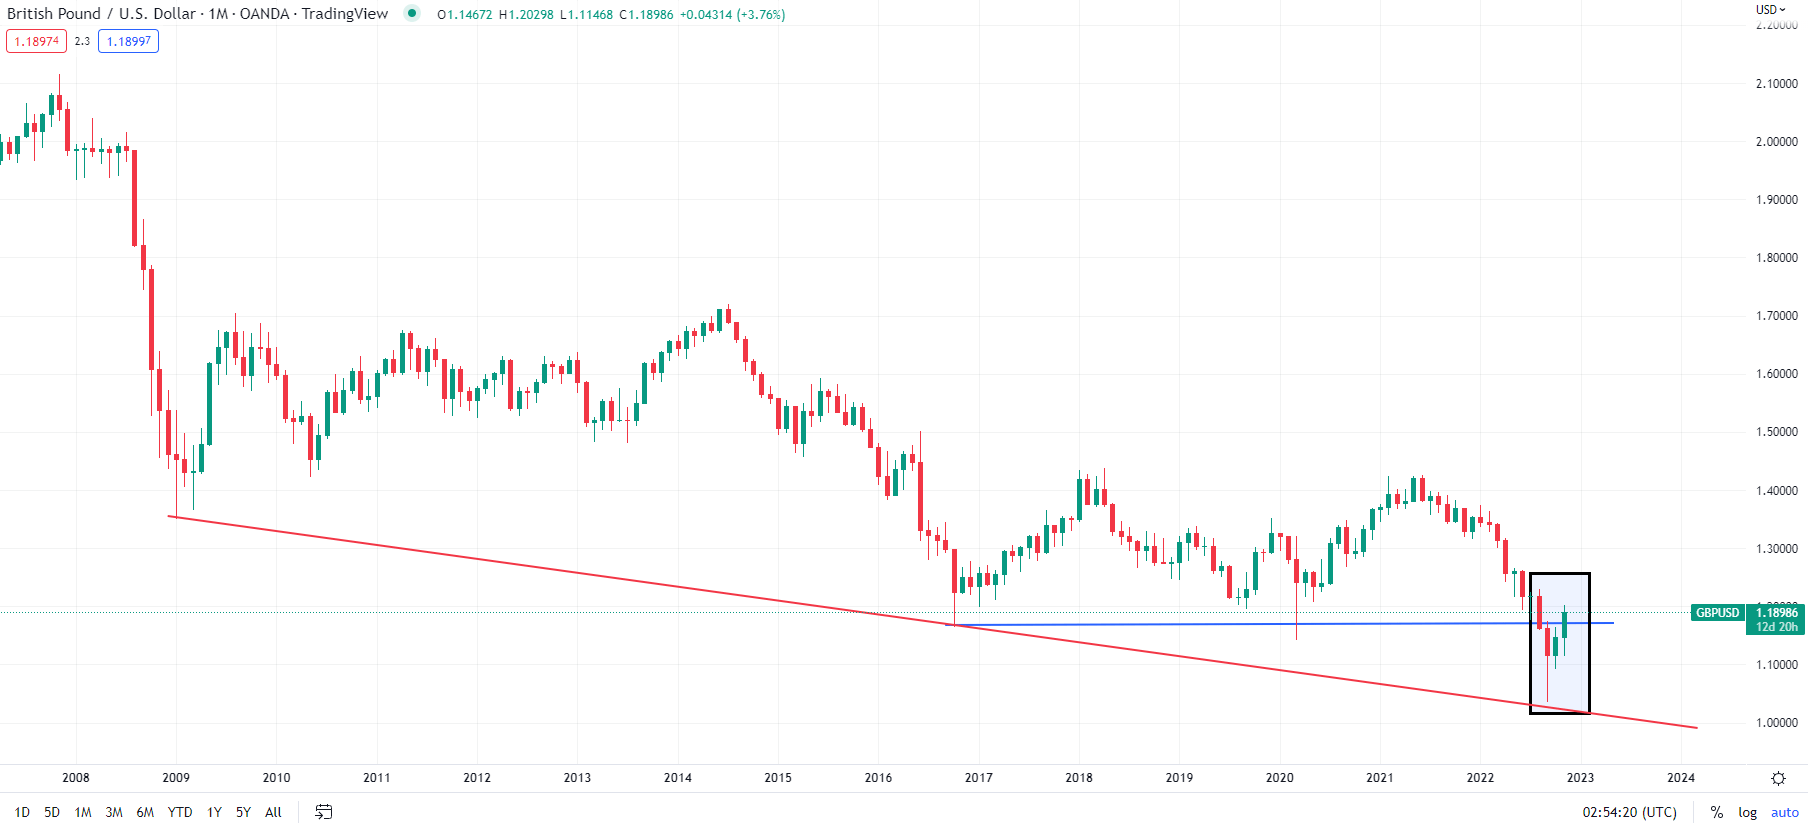
Chart Created Using TradingView
A stronger signal that the worst is over for GBP/USD would be a rise above the August high of 1.2295, roughly coinciding with the 200-day moving average (now at about 1.2225).Key support is at the early-November low of 1.1150 –a break below 1.1150 would be a serious blow to the nascent uptrend.

--- Written by Manish Jaradi, Strategist for DailyFX.com


