


GBP/USD, BRITISH POUND - Technical Outlook:
- GBP/USD’s medium-term trend could be turning up.
- A major bullish technical pattern appears to be developing
- What are the signposts to watch?

GBP/USD MEDIUM-TERM TECHNICAL FORECAST – NEUTRAL
GBP/USD could be getting ripe for another leg higher which could possibly open the door for a multi-month ascent.
Since late last year, GBP/USD charts have given indications of capitulation/medium-term bottom,highlighted in Octoberand subsequentlyin mid-November. In recent weeks, there has been more evidence supporting the view. The pair has retraced 100 of the August-September decline, which was the ‘last supply point’. A recouping of the losses of the final leg lower tends to indicate that bears are exhausted, implying that the path of least resistance is sideways to up.
GBP/USD Weekly Chart
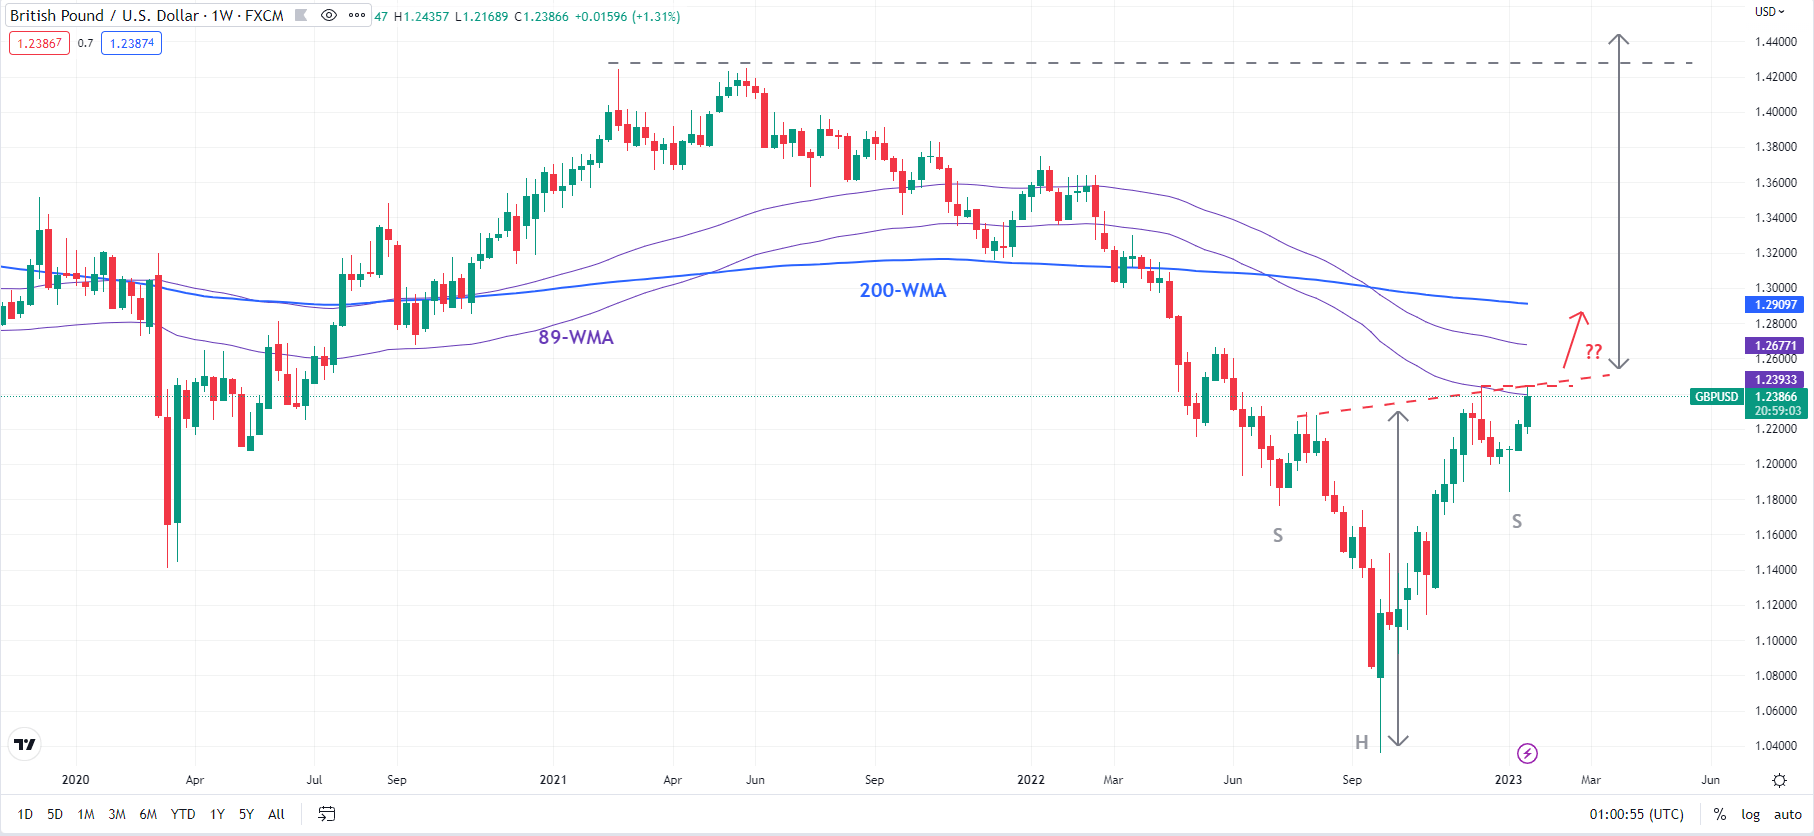
Chart Created Using TradingView
And chances are that the medium-term trend could be turning bullish. The pair is attempting to break above key converged resistance: a slightly upward-sloping trendline from August (now at about 1.2475), roughly coinciding with the December high of 1.2445. A decisive break above would trigger a major reverse head & shoulders pattern (the left shoulder at the July low, the head at the September low, and the right shoulder at the January low), pointing to a potential rise toward the 2021 high of 1.4250.
GBP/USD Monthly Chart
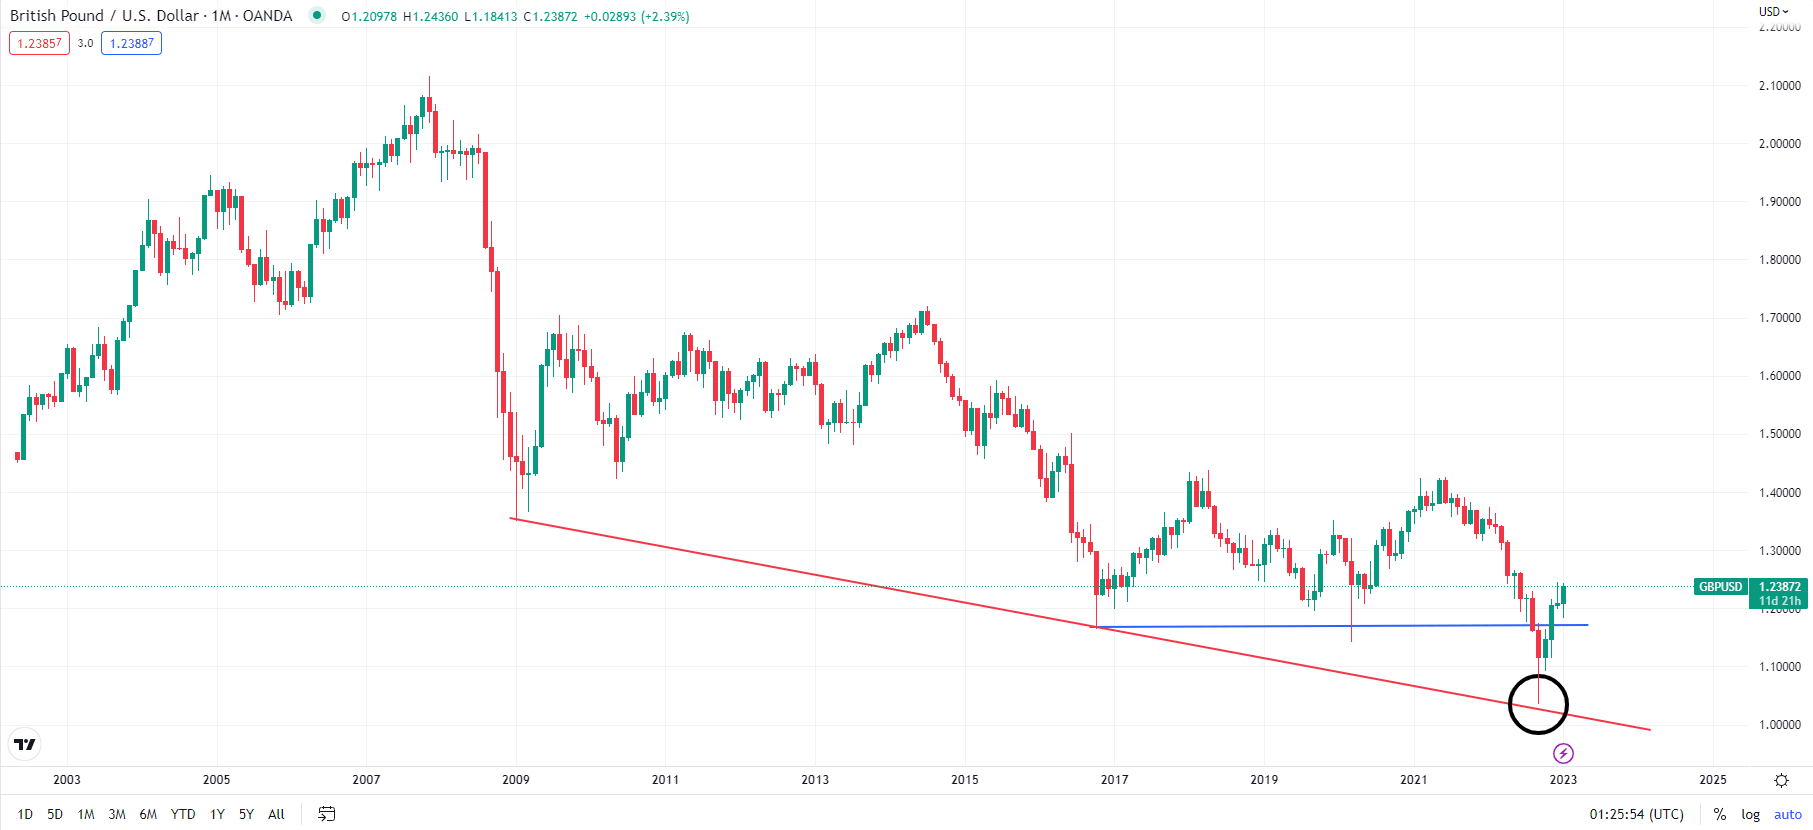
Chart Created Using TradingView
Having said that, the path could be bumpy with several hurdles along the way, beginning with the 89-week moving average (WMA) followed by the 200-WMA (now at about 1.2900). Importantly, for the bullish view to hold, GBP/USD needs to stay above the October high of 1.1645. Immediate support is at the early-January low of 1.1840.

--- Written by Manish Jaradi, Strategist for DailyFX.com


