


Bitcoin, BTC/USD - Technical Outlook:
- Bitcoin’s failure to extend lower recently is an encouraging sign for bulls.
- Has BTC/USD capitulated?
- What are the possible scenarios at the key signposts to watch?

BITCOIN SHORT-TERM TECHNICAL OUTLOOK - NEUTRAL
The apparent failure of Bitcoin to extend its losses in the past two weeks could be an early sign that cryptocurrencies may have run their bearish course for now.
Granted, price action is still unfolding and BTC/USD could still embark on another leg lower. However, the stalling of the down move recently keeps alive the possibility that the early-November decline could be ‘capitulation’. If this were indeed the case, a base-building process in BTC/USD could be in play – a relatively high probability scenario highlighted on November 15.
BTC/USD Weekly Chart
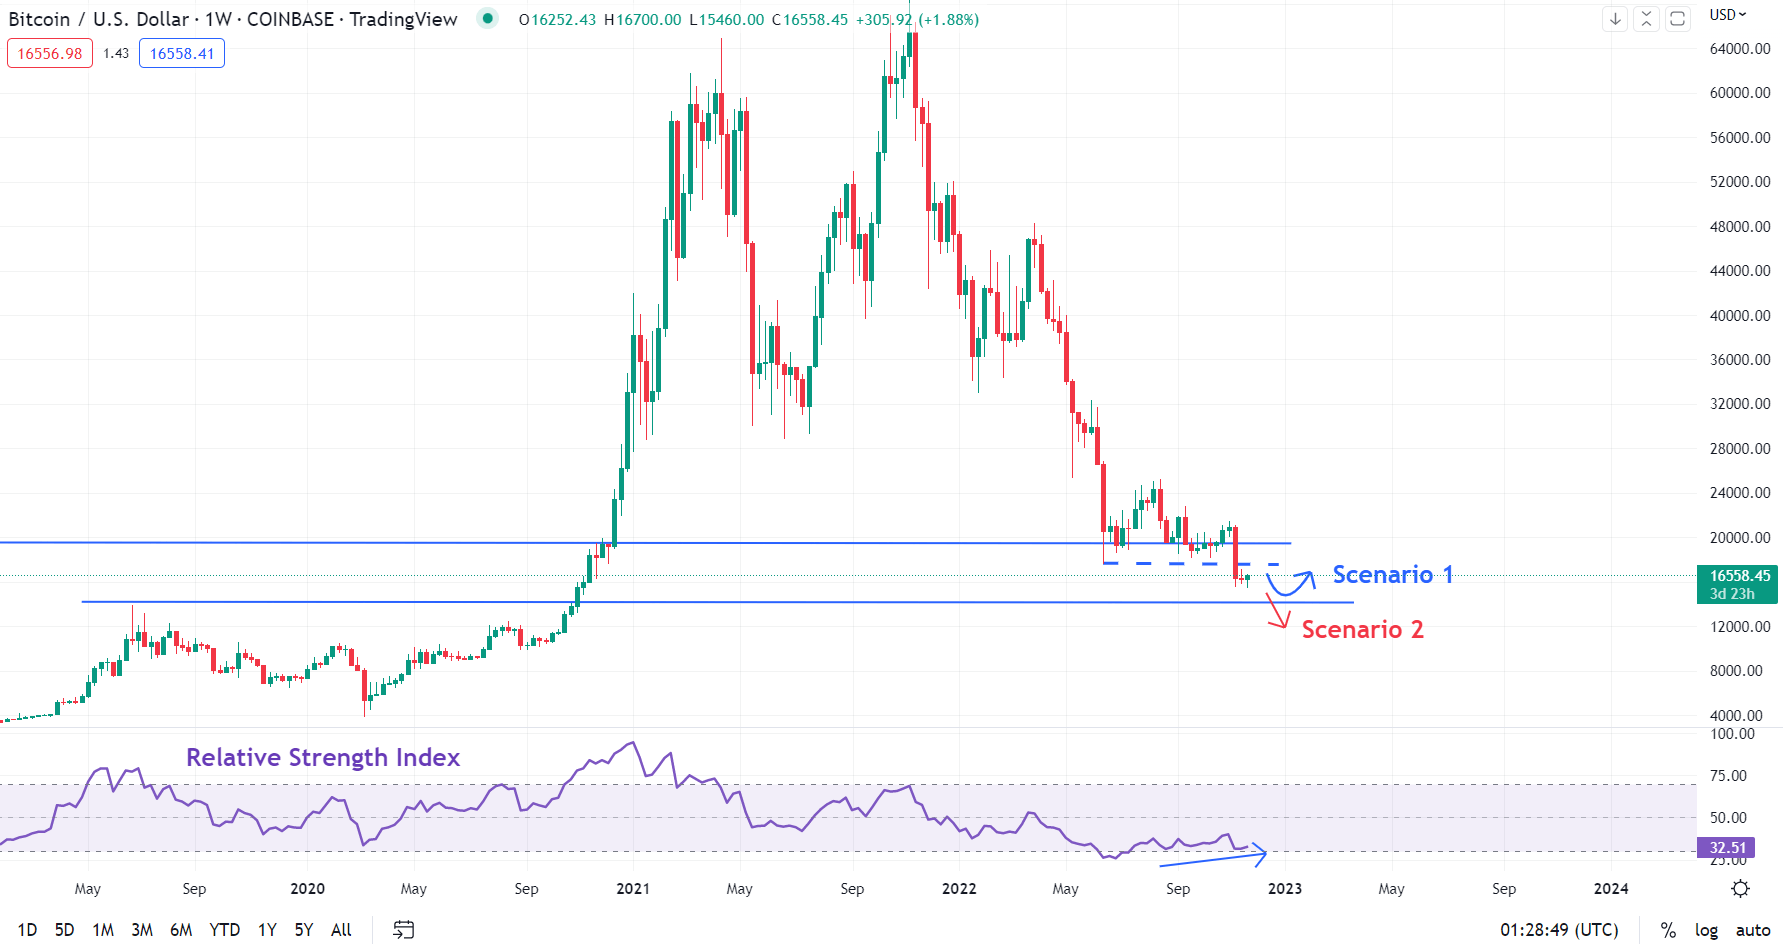
Chart Created Using TradingView
Momentum on the weekly chart didn’t make a new low as spot fell below its June bottom of 17590. Momentum is indicative of force, and when support levels are broken with stronger downside conviction, this generally signifies further weakness in price. The 14-week Relative Strength Index (RSI) is now above its June low, suggesting positive momentum divergence (a new low in price associated with a higher low in momentum).
BTC/USD Daily Chart
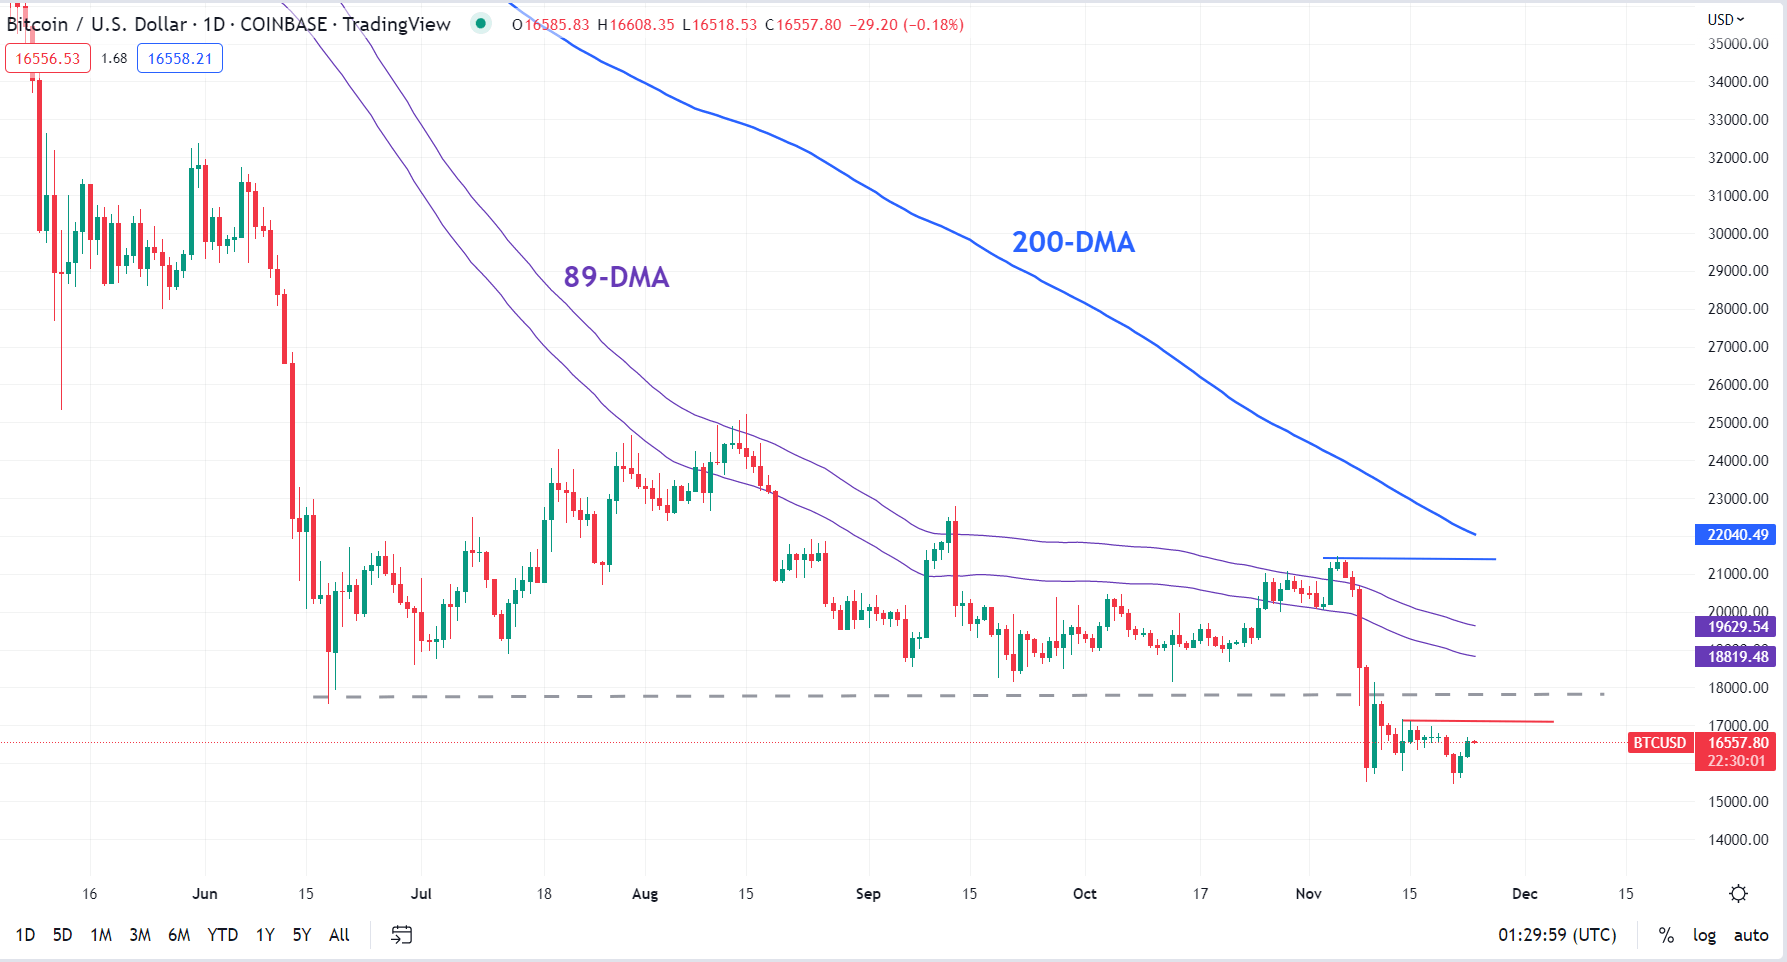
Chart Created Using TradingView
One of the signposts to watch for Scenario 1 to play out would be a break above immediate resistance at the mid-November high of 17170. Such a move would indicate that immediate downward pressure is beginning to ease. A stronger signal would be a rise above the November 10 high of 18140, which could bring into play the 5 November high of 21470, near the 200-day moving average.
The second scenario, and a relatively low probability one, would see BTC/USD extend its weakness initially toward the 2019 high of 13895, and possibly lower. A decisive break below the November 9 low of 15510 could be the first signpost to watch for the bearish scenario to unfold.

--- Written by Manish Jaradi, Strategist for DailyFX.com


