


Bitcoin, BTC/USD - Technical Outlook:
- Bitcoin has fallen below key technical support.
- Has it resumed its medium-term weakness?
- What is the outlook for BTC/USD and the key levels to watch?

BITCOIN SHORT-TERM TECHNICAL OUTLOOK - NEUTRAL
Bitcoin has fallen below the June low of 17590 following last week’s plunge. However, it may be too soon to conclude that cryptocurrencies have resumed their medium-term weakness.
BTC/USD has pulled back from the top end of an upward-sloping channel from September, coinciding with the 89-day moving average (see Daily chart). This isn’t surprising given the rebounds in August and September were capped by the moving average. In the process, however, BTC/USD has not only broken below support at the 3 November low of 20040, but it has also fallen below the June low (the previous update had highlighted the risk of a retest of the June low of 17590.
BTC/USD Weekly Chart
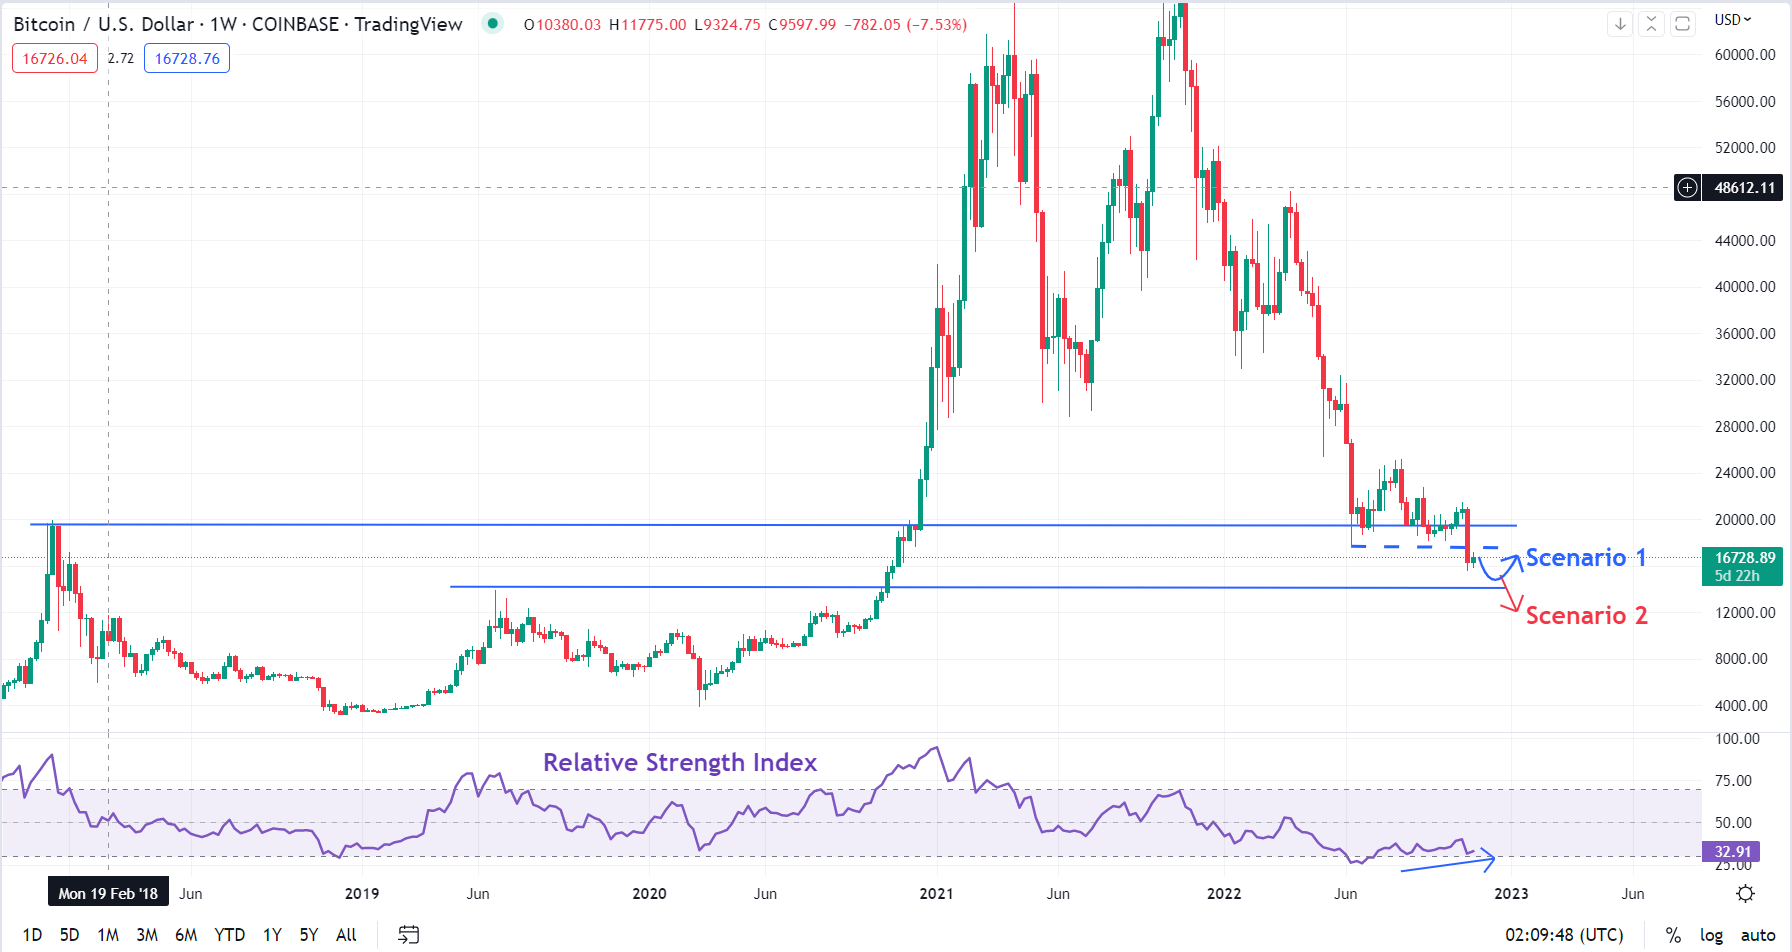
Chart Created Using TradingView
While the fall to a new two-year low is significant, on its own, it may not be sufficient to conclude renewed bearishness for two reasons. BTC/USD’s losses have stalled in recent days following the big drop last week. A new downtrend is typically associated with a market making new lows, and the lack of it, at least for now, leaves open the faint possibility of a false break lower.
Secondly, momentum on the weekly chart hasn’t made a new low even though the spot fell below its June low. Momentum is indicative of force and when support levels are broken on stronger downside momentum, it generally signifies more decline in price. The 14-week Relative Strength Index is now above its June low – suggesting positive momentum divergence (a new low in price associated with a higher low in momentum).
BTC/USD Daily Chart
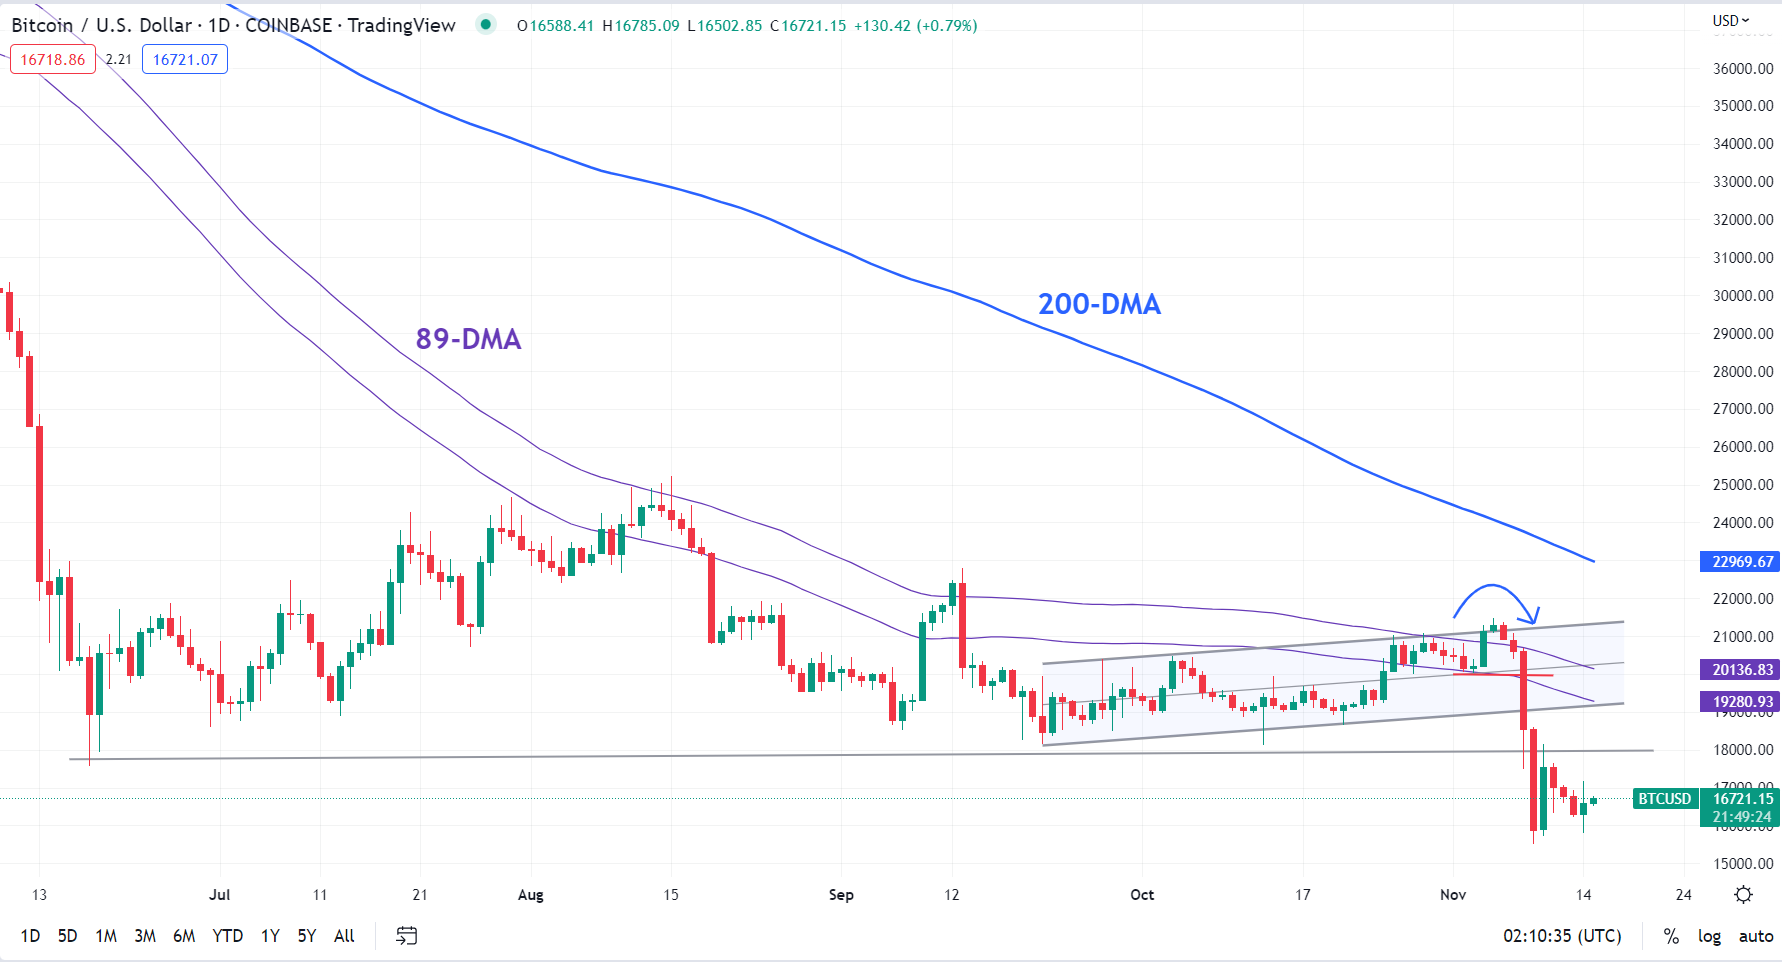
Chart Created Using TradingView
Put together, this could be part of a broader base-building process in BTC/USD, which is associated with frequent retests of the lows and high volatility around the lows. But for this view to hold, BTC/USD needs to, at the very least, break above immediate resistance at Thursday’s high of 18200. Any break above 18200 could bring into play the 5 November high of 21470.
On the downside, if BTC/USD closes this week below last week’s low, it would bring into focus the 2019 high of 13895. While not unlikely, this could be a low probability event (Scenario 2 in the chart). In comparison, Scenario 1 appears to be a relatively higher probability outcome.

--- Written by Manish Jaradi, Strategist for DailyFX.com


