


Bitcoin, BTC/USD - Technical Outlook:
- Bitcoin’s recent retreat appears to be part of the consolidation that started earlier this month.
- The two-month-long uptrend remains intact.
- What are the key levels to watch?

BITCOIN TECHNICAL OUTLOOK - BULLISH
The retreat in recent days in Bitcoin appears to be a consolidation rather than a reversal of the two-month-long uptrend, at least yet.
Bitcoin has pulled back from a tough barrier at the August 2022 high of 25200, near the 200-week moving average (now at about 25100) – a possibility highlighted in the previous update. See “Bitcoin doesn’t appear to be ripe for a bullish break just yet”, published Feb. 19. Moreover, as highlighted in recent weeks, BTC/USD needs to clear 25200 for the medium-term downward pressure to ease, including the August 2022 high. (See the mid-January update.)
BTC/USD Daily Chart
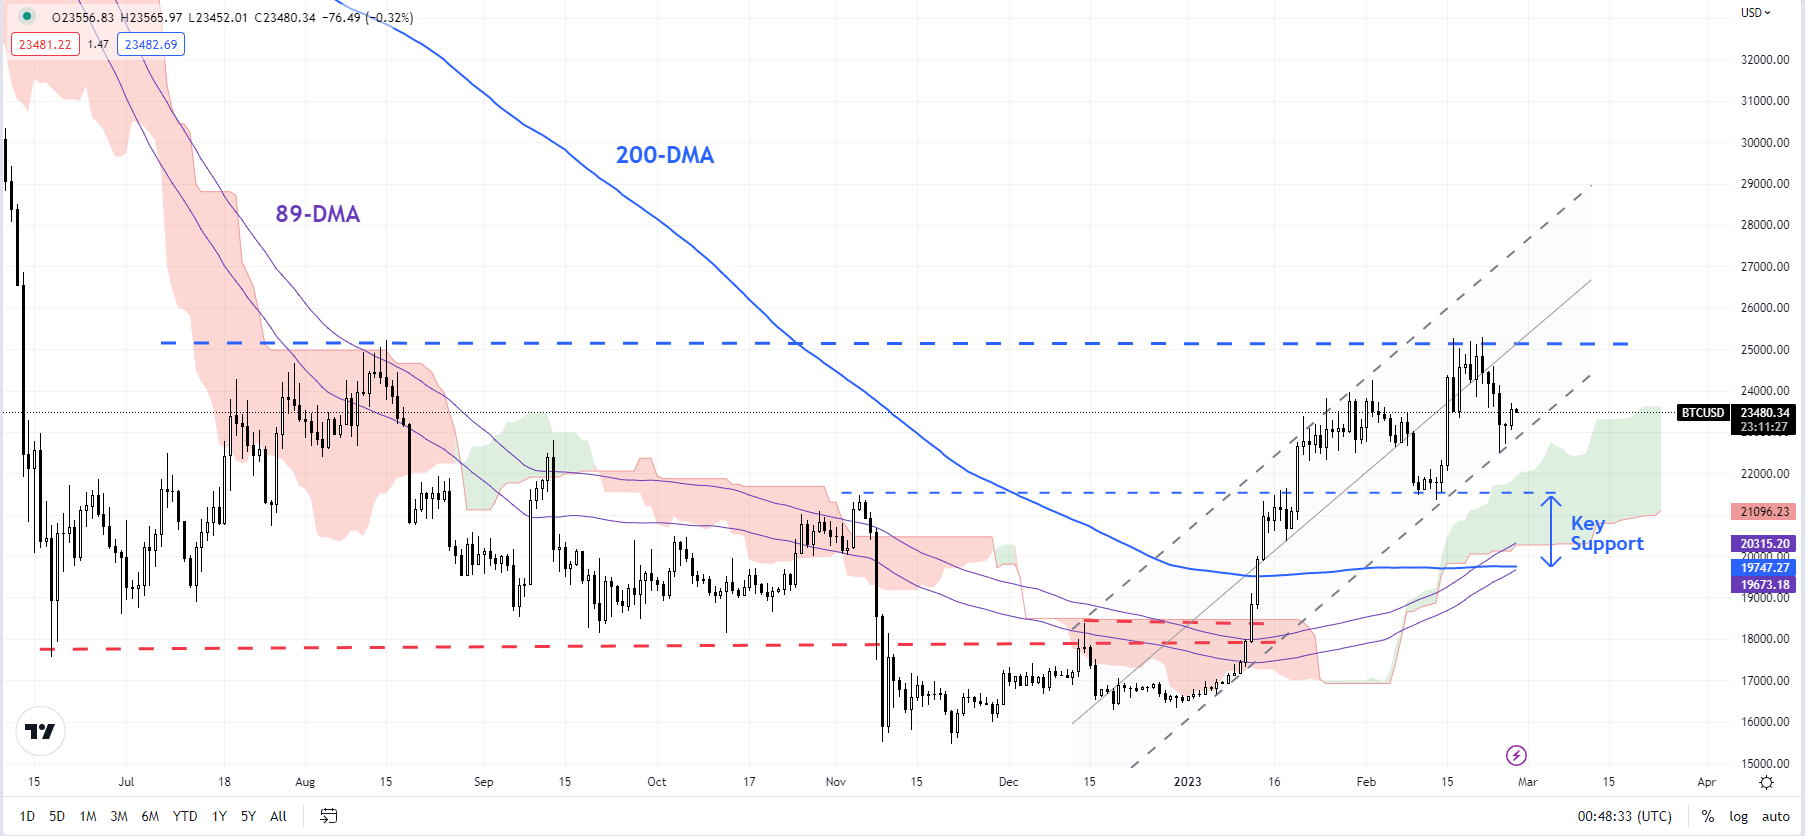
Chart Created Using TradingView
Momentum on the daily charts has saturated given the pace and the extent of the rise since the start of the year, and the fall last week below immediate support on a horizontal trendline from late January at about 23800, confirms that the upward pressure has eased a bit. Overall, last week’s price action is further evidence that the mid-February jump was part of a broader consolidation that started earlier this month.
BTC/USD Daily Chart
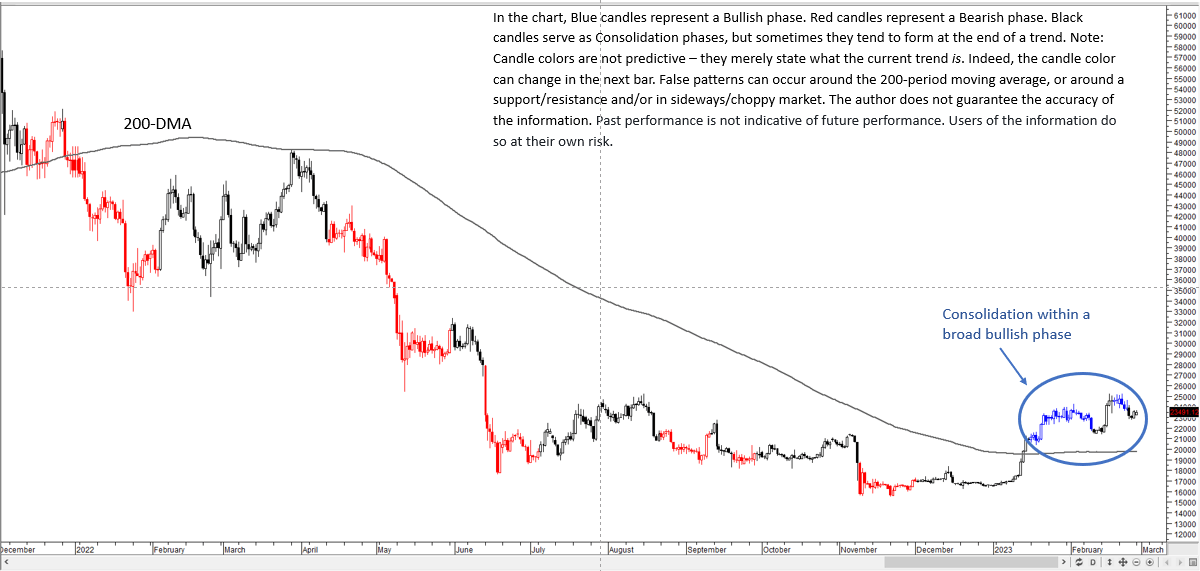
Chart created by Manish Jaradi using Metastock
The color-coded candlestick charts, based on trending/momentum indicators, suggest that the current softness is a consolidation phase within the overall bullish phase. If this is indeed the case, then BTC/USD needs to hold above immediate converged cushion at 19500-21400 (see the daily chart).
BTC/USD 240-minute Chart
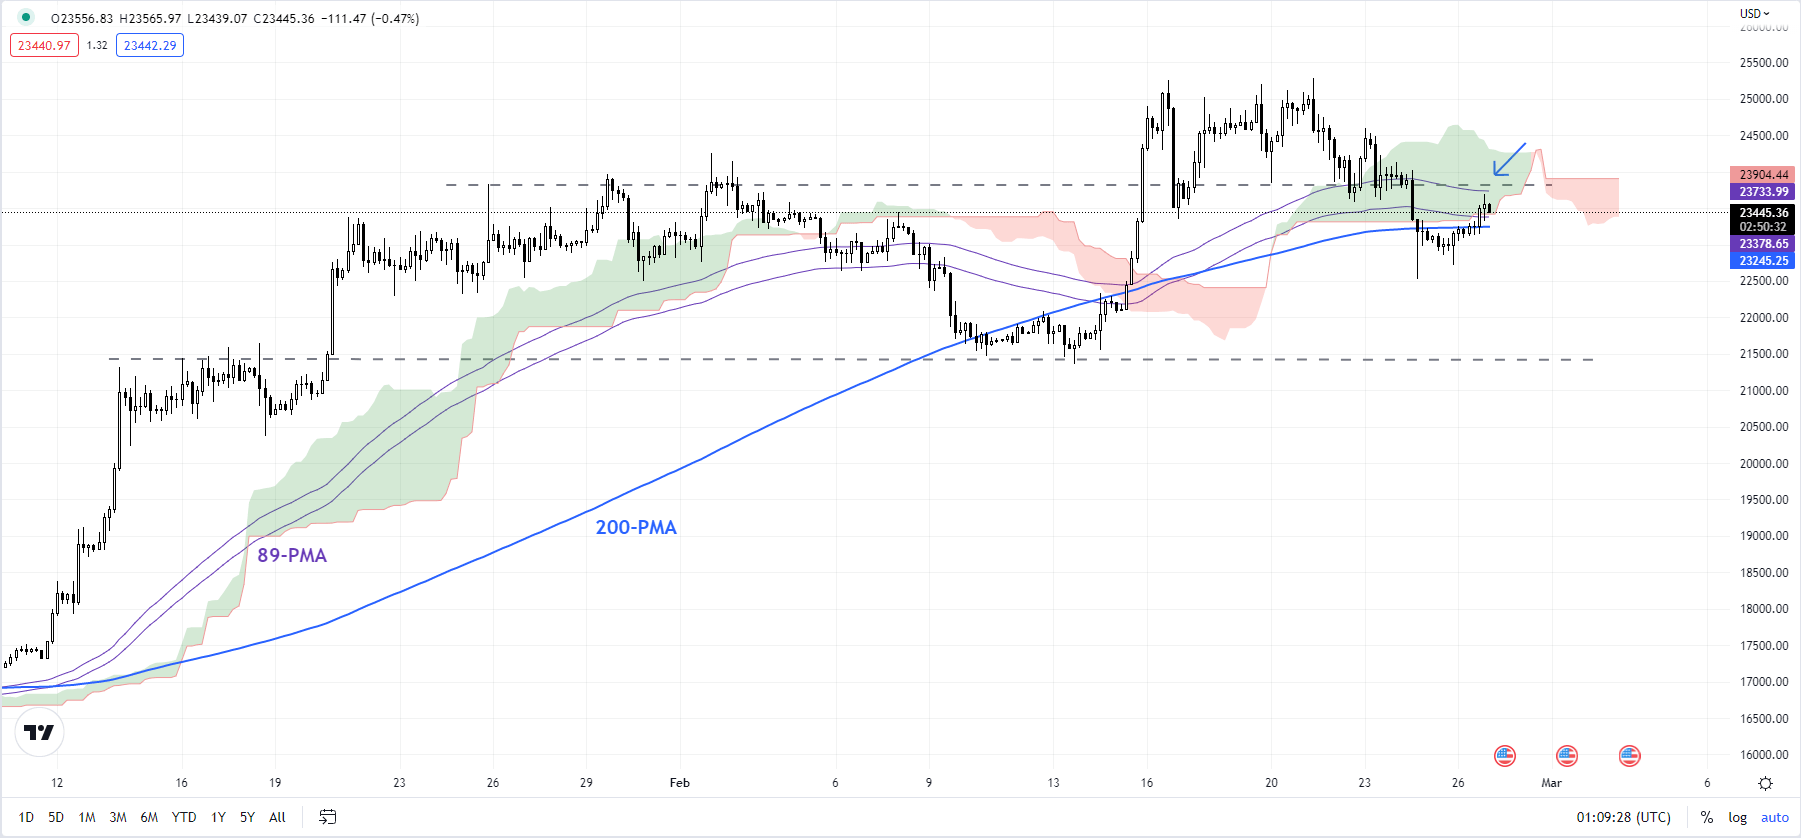
Chart Created Using TradingView
Any break below the converged support would confirm that the two-month-long uptrend had reversed. Such a break would be part of the broader base-building pattern in cryptocurrencies since mid-2022 (See the mid-November update). In this regard, the Average True Range-based indicator on the weekly chart is showing tentative signs that the downtrend could be starting to reverse.
BTC/USD Weekly Chart
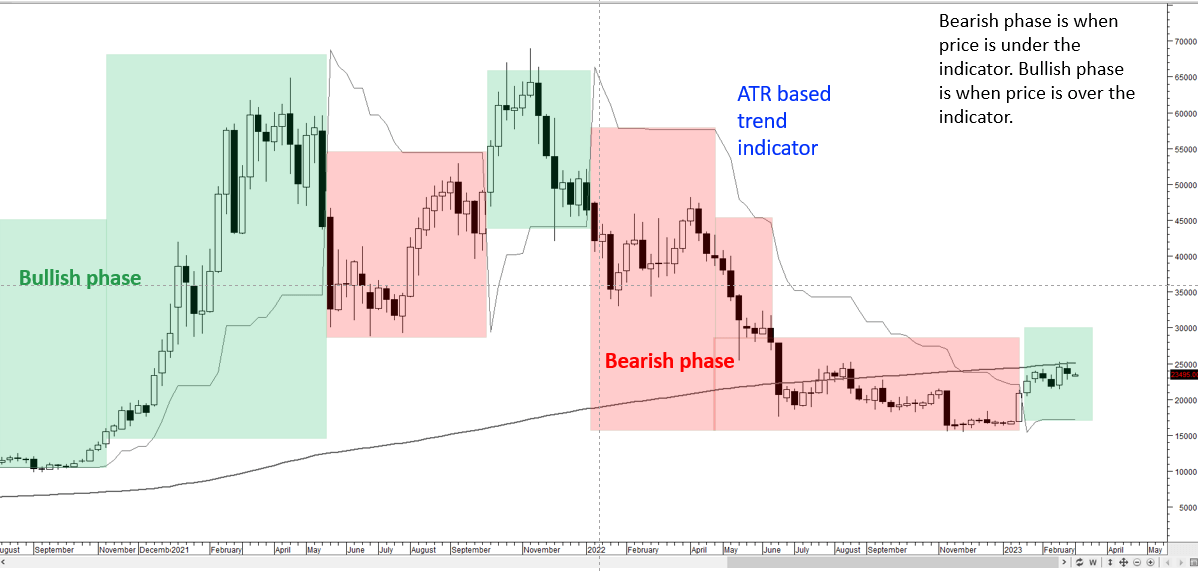
Chart created by Manish Jaradi using Metastock
--- Written by Manish Jaradi, Strategist for DailyFX.com


