


Bitcoin, BTC/USD - Technical Outlook:
- Bitcoin’s jump earlier in the week could be part of the consolidation that start a few weeks ago.
- However, the corrective uptrend remains intact.
- What are the key levels to watch?

BITCOIN SHORT-TERM TECHNICAL OUTLOOK - BULLISH
Subdued upward momentum associated with the recent jump suggests Bitcoin’s rally is showing some signs of fatigue as it tests a tough hurdle.
BTC/USD hit an eight-month high on Thursday and is now testing a crucial ceiling at the August 2022 high of 25200, near the 200-week moving average (now at about 24925). BTC/USD needs to clear the 24650-25200 area for the medium-term downward pressure to ease (see the mid-January update).
BTC/USD Daily Chart
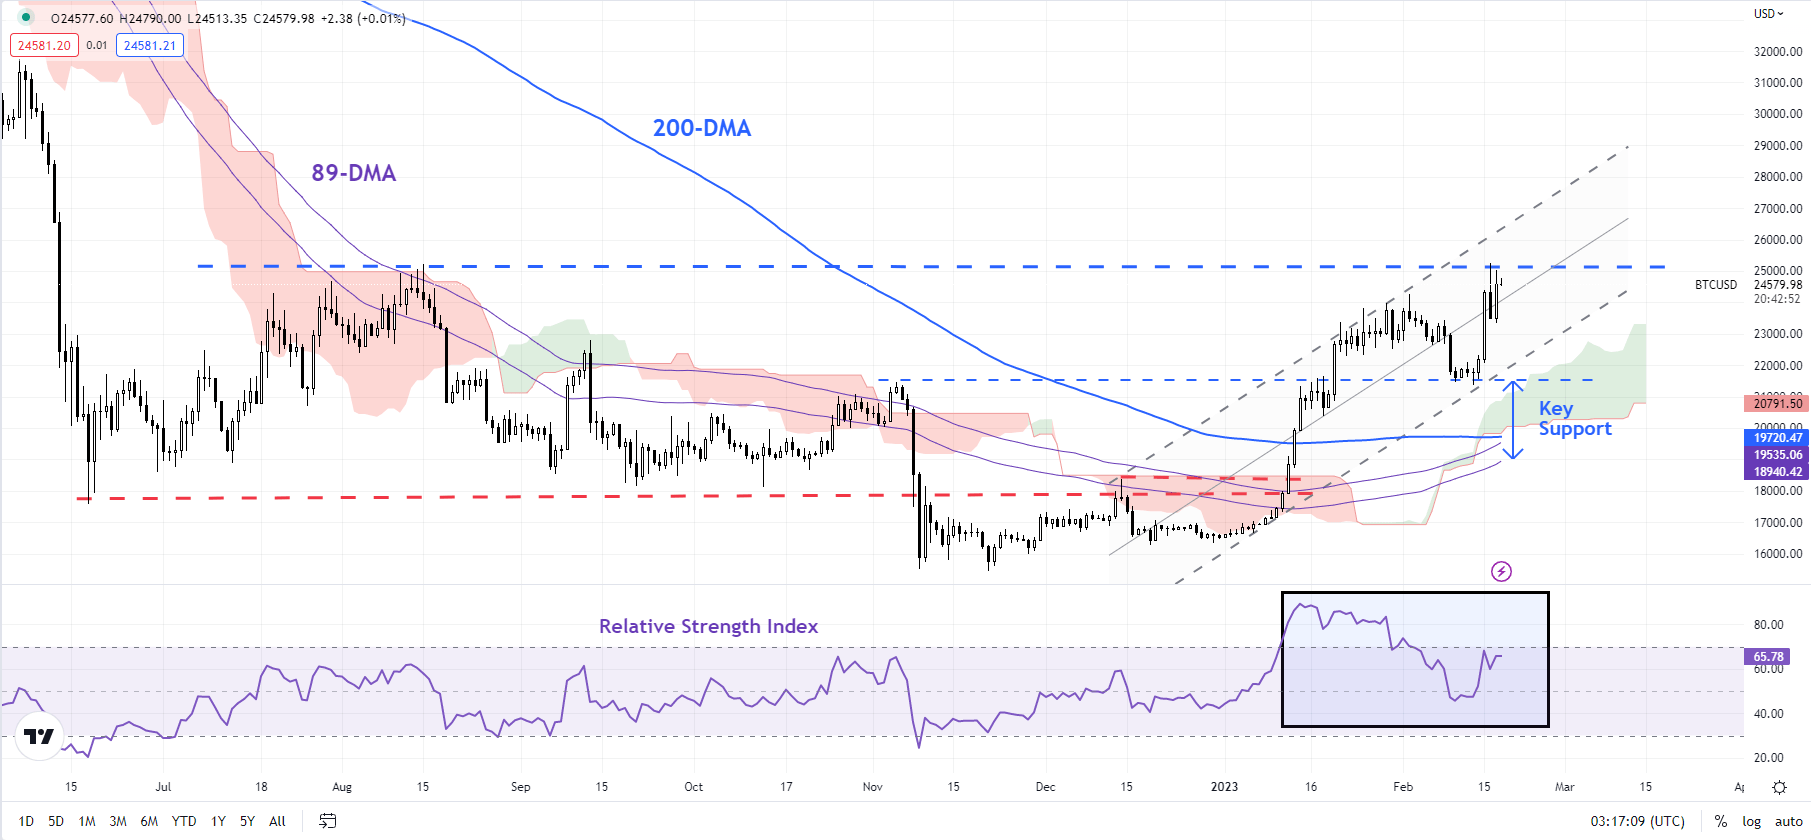
Chart Created Using TradingView
Despite the rise to a multi-month high, the 14-day Relative Strength Index (RSI) failed to mirror the strength. Indeed, the lower high in RSI is a sign that BTC/USD may not be ripe to break past the immediate barrier at 24650-25200 just yet. In other words, the last week’s jump could be part of the broader consolidation that started end of January, and not the start of a new leg higher.
Bitcoin could continue to remain in the recently well-established range 21350-25250 in the interim. Meanwhile, the short-term trend continues to be bullish after it broke in January above resistance on the 89-day moving average (a significant barrier since mid-2022), coinciding with another barrier at the mid-December high of 18370. The subsequent break above the 200-day moving average has confirmed that the downward pressure has indeed faded (see “Bitcoin Technical Outlook: BTC/USD Turns Bullish”, published Jan. 18).
BTC/USD Weekly Chart
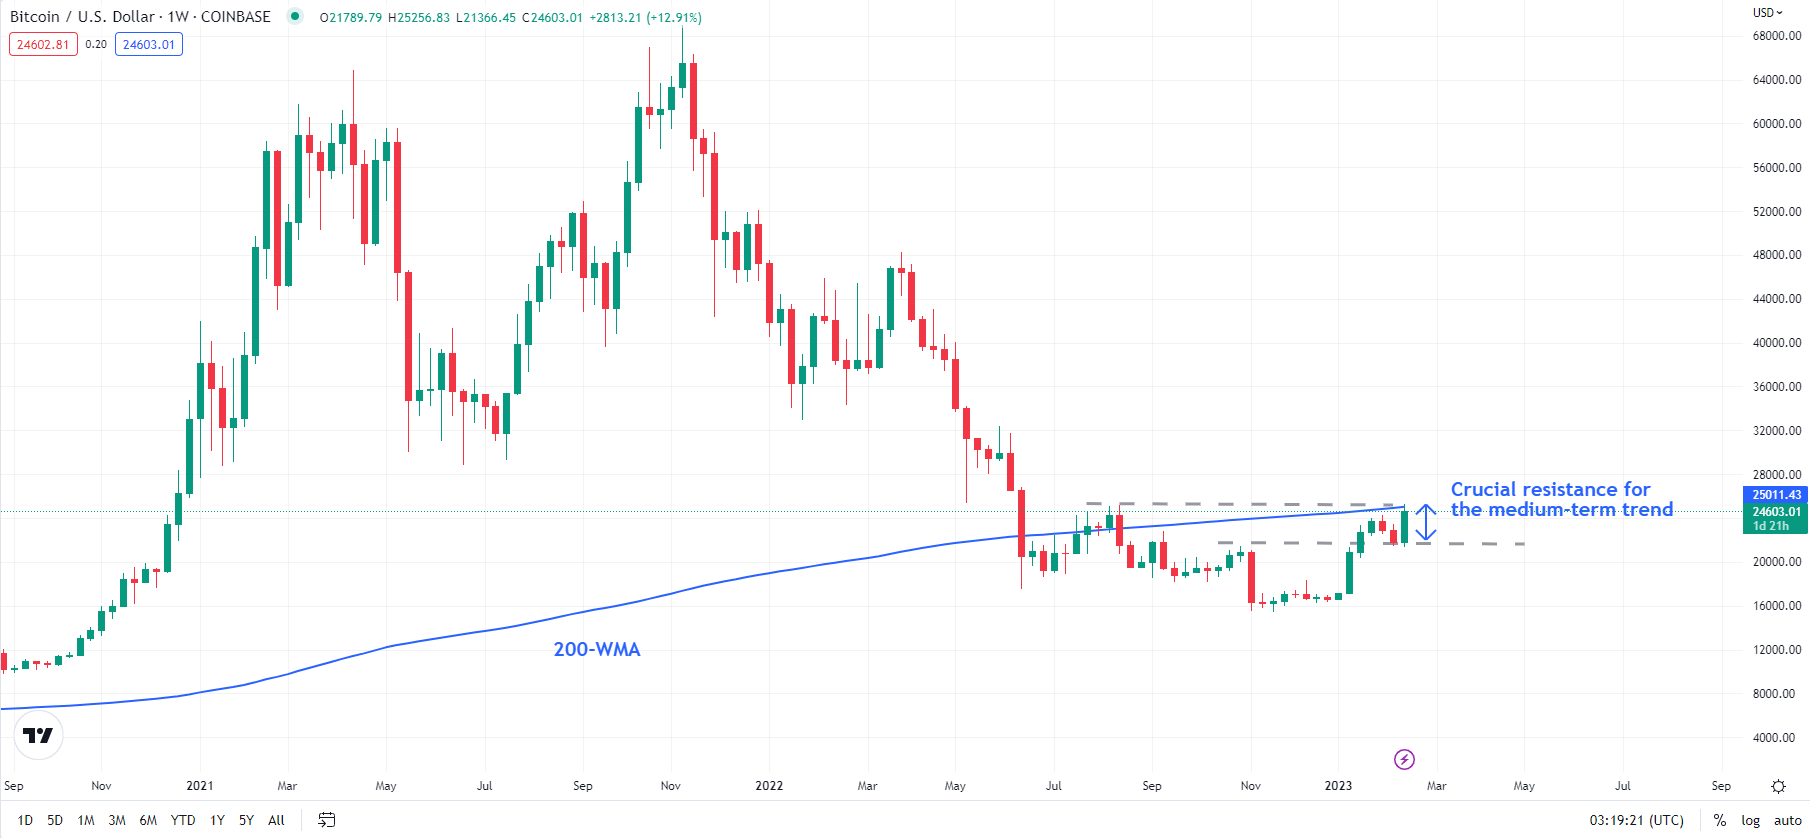
Chart Created Using TradingView
However, for the nascent uptrend to continue, Bitcoin needs to clear the 24650-25200 hurdle. This is especially so if the pattern since mid-2022 is indeed part of a broader base building in cryptocurrencies (see the mid-November update). On the downside, there is fairly strong converged support at 19800-21350 (see the daily chart). The short-term upward pressure is unlikely to fade while BTC/USD holds above the floor.
Trade Smarter - Sign up for the DailyFX Newsletter
Receive timely and compelling market commentary from the DailyFX team
--- Written by Manish Jaradi, Strategist for DailyFX.com


