USD/CAD

USD/CAD
Bullish
 8h
8h
Last updated:
Jul 26, 2024
| Low | |
| High |
of clients are net long.
of clients are net short.
Average True Range
Total Intraday Range (% of ATR)
Note: Low and High figures are for the trading day.
USD/CAD is the forex ticker that represents the US Dollar-Canadian Dollar currency pair. The USD/CAD rate, as indicated on the live chart, shows traders how many Canadian Dollars are required to buy one US Dollar. Follow the USD/CAD chart for live prices and stay up to date with the latest USD/CAD news, forecasts and analysis. Our expert industry insights will give you the edge to conduct thorough fundamental and technical analysis to trade this popular currency pair.
Advertisement
News & Analysis
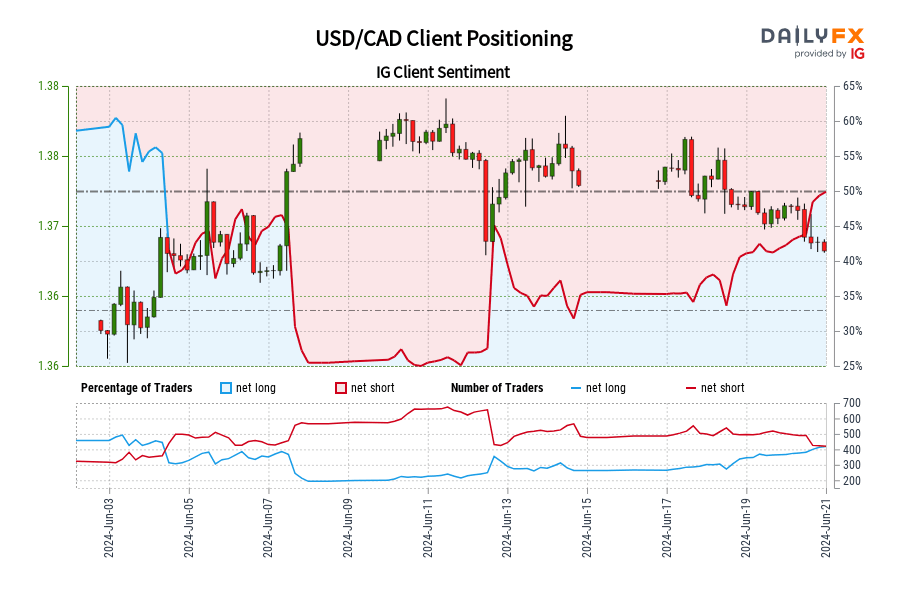
USD/CAD IG Client Sentiment: Our data shows traders are now net-long USD/CAD for the first time since Jun 04, 2024 when USD/CAD traded near 1.37.
2024-06-21 02:23:34

AUD, CAD Technical Update: NFP Data Provides Plenty of Volatility
2024-06-07 15:30:46
BoC Cuts Rates as Inflation Settles into Target Range, CAD Weakens
2024-06-05 14:35:40
Market Sentiment Analysis & Outlook: EUR/USD, USD/CAD, Dow Jones 30
2024-05-30 17:30:00
EUR/USD, USD/JPY, USD/CAD – Sentiment Analysis and Market Outlook
2024-05-13 16:30:00
US Dollar Sentiment Analysis & Outlook: USD/JPY, NZD/USD, USD/CAD
2024-05-07 17:00:00
US Dollar Tanks Ahead of Fed Verdict, NFP Data - EUR/USD, GBP/USD, USD/CAD
2024-04-29 17:30:00
Real Time News

Jul 19, 2024
Follow
Forex Update: As of 14:00, these are your best and worst performers based on the London trading schedule:
🇯🇵JPY: -0.01%
🇪🇺EUR: -0.08%
🇨🇭CHF: -0.13%
🇬🇧GBP: -0.20%
🇦🇺AUD: -0.20%
🇳🇿NZD: -0.42%
View the performance of all markets via https://t.co/Mgr02PP6TS https://t.co/clX4DFTVYD

Jul 19, 2024
Follow
Indices Update: As of 14:00, these are your best and worst performers based on the London trading schedule:
US 500: -0.38%
Wall Street: -0.69%
FTSE 100: -0.71%
France 40: -0.89%
Germany 40: -0.97%
View the performance of all markets via https://t.co/2NUaqnUPED https://t.co/Dncphl5UIk

Jul 19, 2024
Follow
Heads Up:🇺🇸 Fed Williams Speech due at 14:40 GMT (15min)
https://t.co/ikL959ei1A