


WTI TECHNICAL OUTLOOK: BULLISH
- WTI Bullish on Both the Weekly and Daily Timeframe but Remains Rangebound. $82 Handle Holds the Key.
- Morning Star Candlestick Pattern on the Weekly Timeframe Hints at Bullish Continuation.
- US Data Could Add Strength to the Dollar and Cap Gains.
- To Learn More About Price Action,Chart PatternsandMoving Averages, Check out theDailyFX Education Series.

WTI WEEK IN REVIEW
Crude Oil had a bullish week to say the least before a temporary spike down on Friday after a report by the Wall Street Journal reported that the United Arab Emirates (UAE) had an internal debate about leaving OPEC+ and pumping more oil but covered all the losses after UAE officials confirmed that they have no plans to leave OPEC+.
Most Read: Natural Gas Prices Stuck at Resistance as Momentum Fades, Will Prices Turn?
Earlier in the week oil prices received a boost as Chinese manufacturing data beat estimates rekindling hope of a demand surge. Friday morning also saw the Caixin services PMI data grew at its fastest pace in 6 months. Top Chinese officials are extremely upbeat about the recent data stating that it has exceeded their expectations with officials apparently targeting an ambitious growth target of 6% for 2023.
TECHNICAL OUTLOOK
WTI Crude Oil Weekly Chart – March 3, 2023
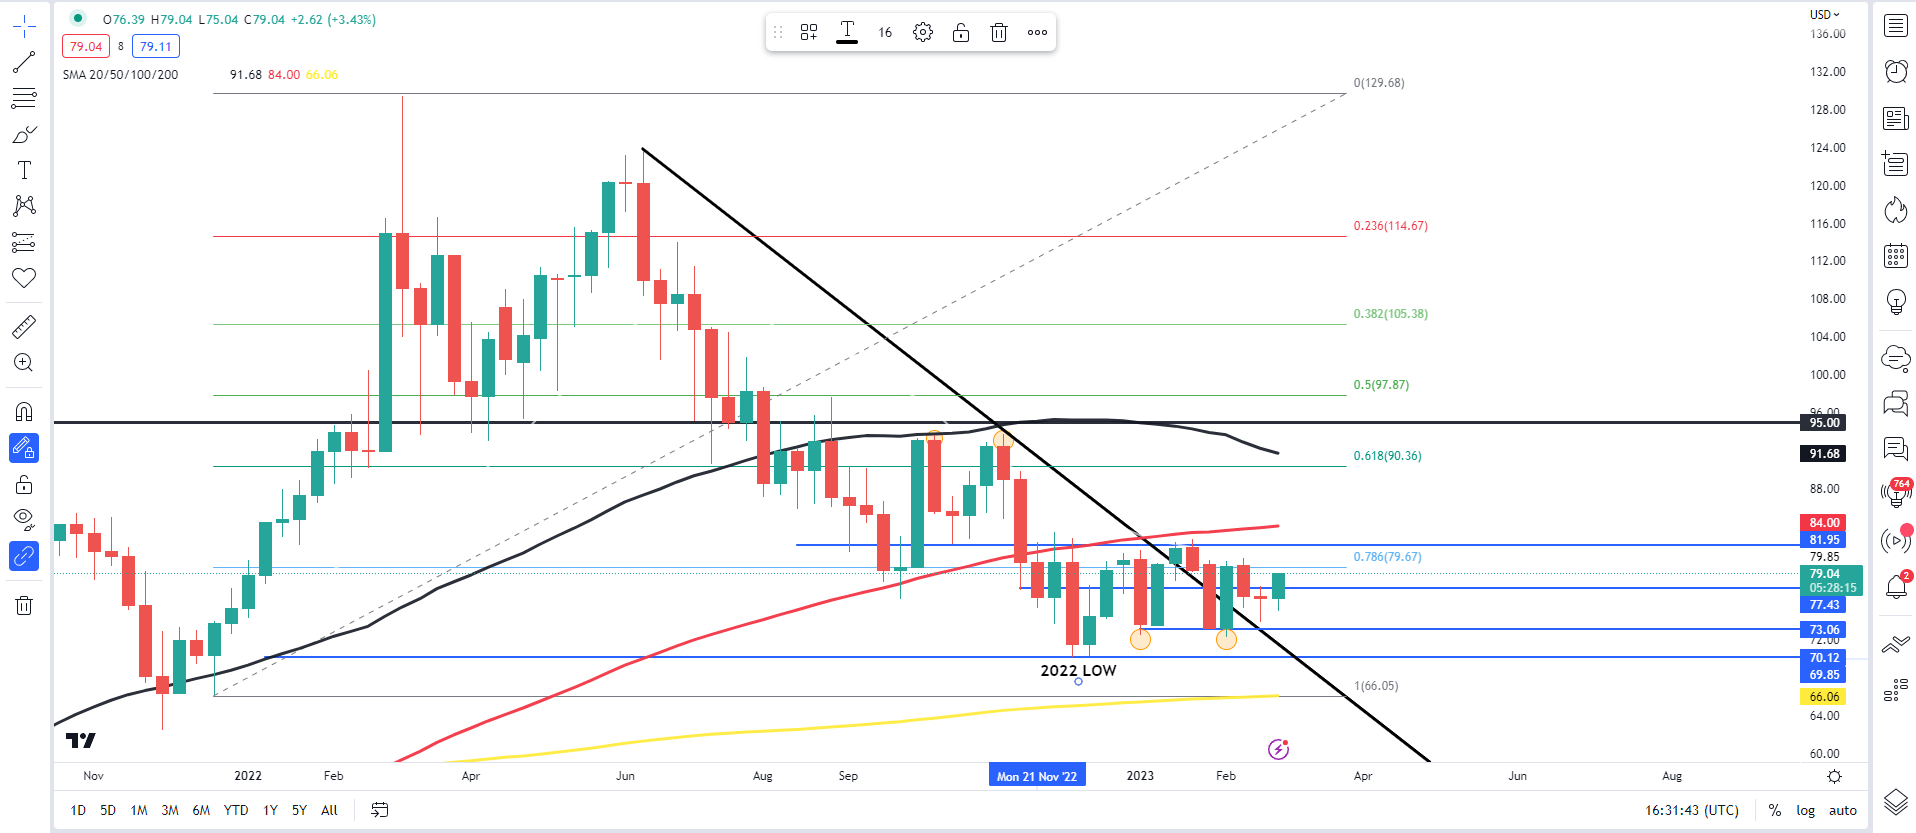
Source: TradingView
The weekly chart is on course to post a Morningstar candlestick pattern of the bottom of the range which has been in play since the start of the year. WTI has been stuck between the $73 a barrel mark and the top of the range resting at the $82 a barrel mark with the 100-day MA resting above at the $84 handle. Next week will be key if we are to see further upside, we do require a weekly candle close above the $82 handle.
WTI Crude Oil Daily Chart – March 3, 2023
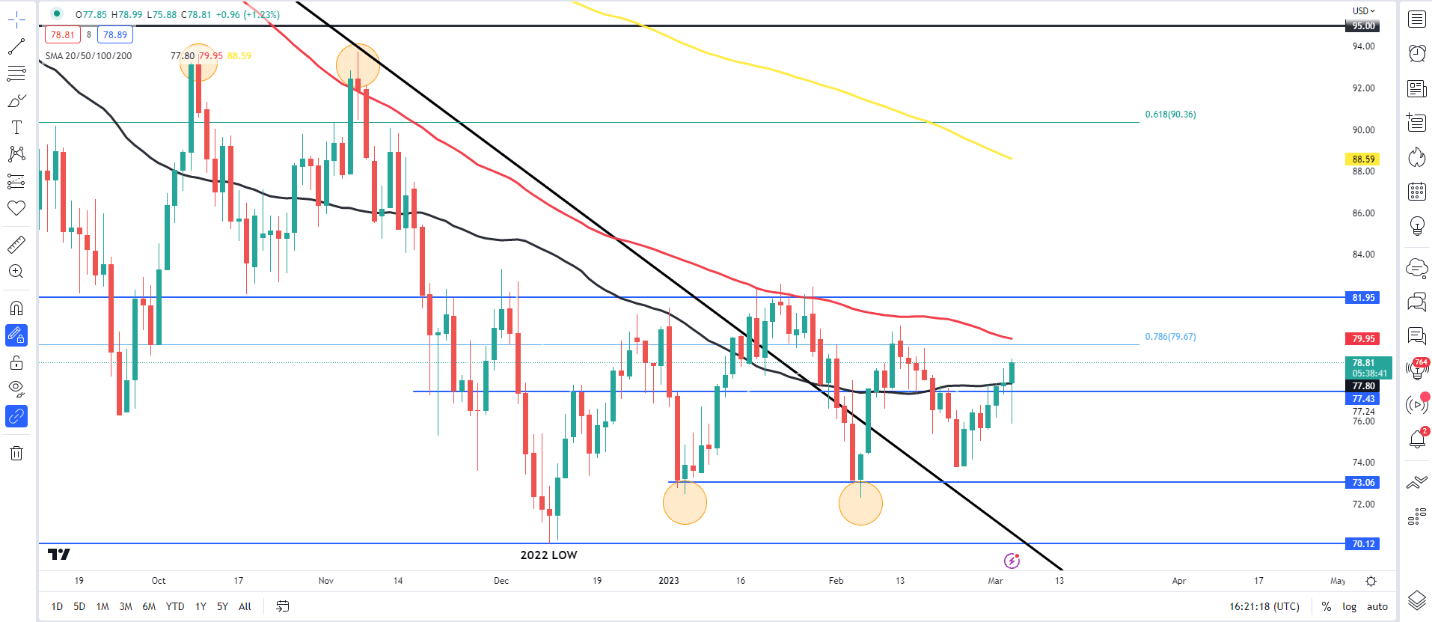
Source: TradingView
The daily timeframe remains interesting with price action mixed as we have seen a lower high swing (FEB 13) followed up by a higher low (FEB 23) as the range discussed above continues to keep gains and losses capped since the start of the year.
We can see the whipsaw price action on Friday which came about due to the rumors around the UAE potentially leaving OPEC+. Price is currently trading above the 50-day MA with immediate resistance resting at the 100-day MA around the $80 handle. Above the $80 handle we have the top of the range at $82 with price failing to break above this key level since November 18 2022. Given the length of time we have spent below this level a break above and daily candle close could see us rally quickly toward the 200-day MA around the $88.60 mark. Caution remains however as we do have some big US data events next week with testimony from Fed Chair Jerome Powell and the NFP jobs report which could add further strength to the USD and cap gains.
Trade Smarter - Sign up for the DailyFX Newsletter
Receive timely and compelling market commentary from the DailyFX team
Resources for Traders
Whether you are a new or experienced trader, we have several resources available to help you; indicators for tracking trader sentiment, quarterly trading forecasts, analytical and educational webinars held daily, trading guides to help you improve trading performance, and one specifically for those who are new to forex.
Written by: Zain Vawda, Market Writer for DailyFX.com
Contact and follow Zain on Twitter: @zvawda


