


Natural Gas, Doji, Fading Momentum, Rising Wedge – Technical Update:
- Natural gas prices struggling to hold near-term momentum
- A Doji candlestick pattern has emerged, showing indecision
- Keep an eye on the brewing Rising Wedge on the 4-hour
Trade Smarter - Sign up for the DailyFX Newsletter
Receive timely and compelling market commentary from the DailyFX team
Daily Chart – Doji Candlestick in Focus
Natural gas prices struggled to push higher for a seventh consecutive day this week, ending a 6-day winning streak. Over the past 24 hours, a Doji candlestick pattern emerged. That is a sign of indecision. While not necessarily an impending sign of a reversal, downside confirmation from here could open the door to a turn lower. Immediate support seems to be the 20-day Simple Moving Average (SMA).
A drop through the latter exposes the February low at 1.967 before the 2020 low comes into focus at 1.44. Immediate support is a combination of the 23.6% Fibonacci retracement level at 2.297 as well as the 50-day SMA. Clearing these points would open the door to extending near-term gains. But, the falling trendline from August continues to maintain the broader downside focus.
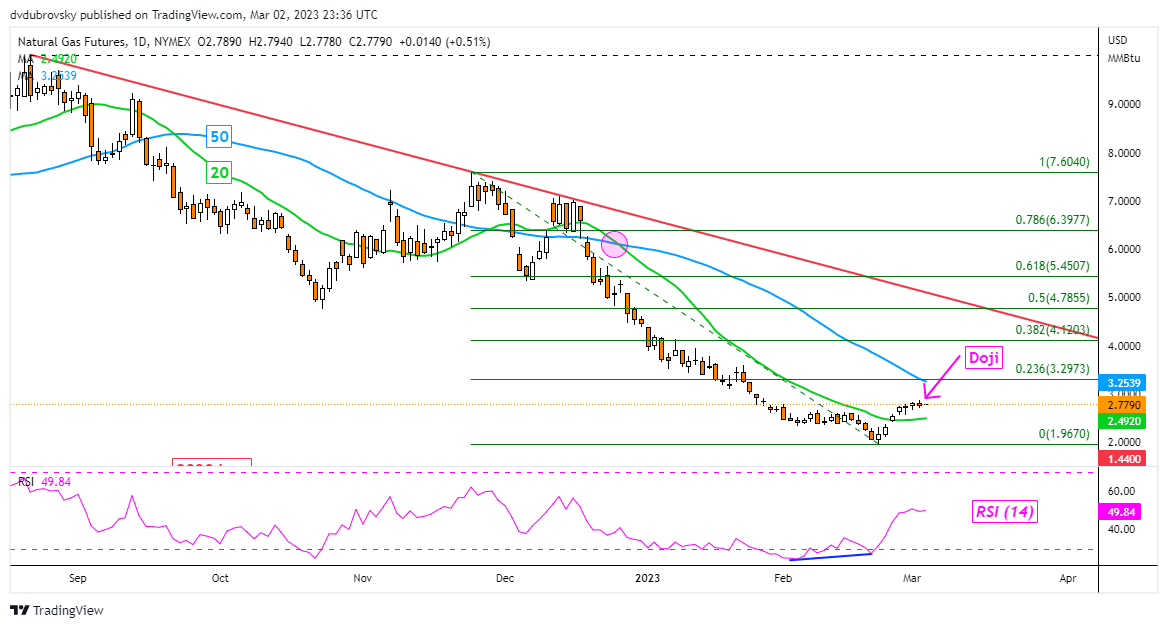
Chart Created Using TradingView
4-Hour Chart – Fading Upside Momentum
Zooming in on the 4-hour timeframe helps paint a better picture of how natural gas is struggling at resistance. Negative RSI divergence is emerging as prices appear to be stuttering at the midpoint of the Fibonacci retracement level at 2.782. That is a sign of fading upside momentum, which can at times precede a turn lower.
Meanwhile, prices continue to trade within the boundaries of a bearish Rising Wedge chart formation. However, the floor is immediate support. A breakout lower could open the door to resuming the near-term downtrend from late January into the end of last month. That would place the focus on the 100-period SMA. That latter could hold as support, pivoting prices higher.

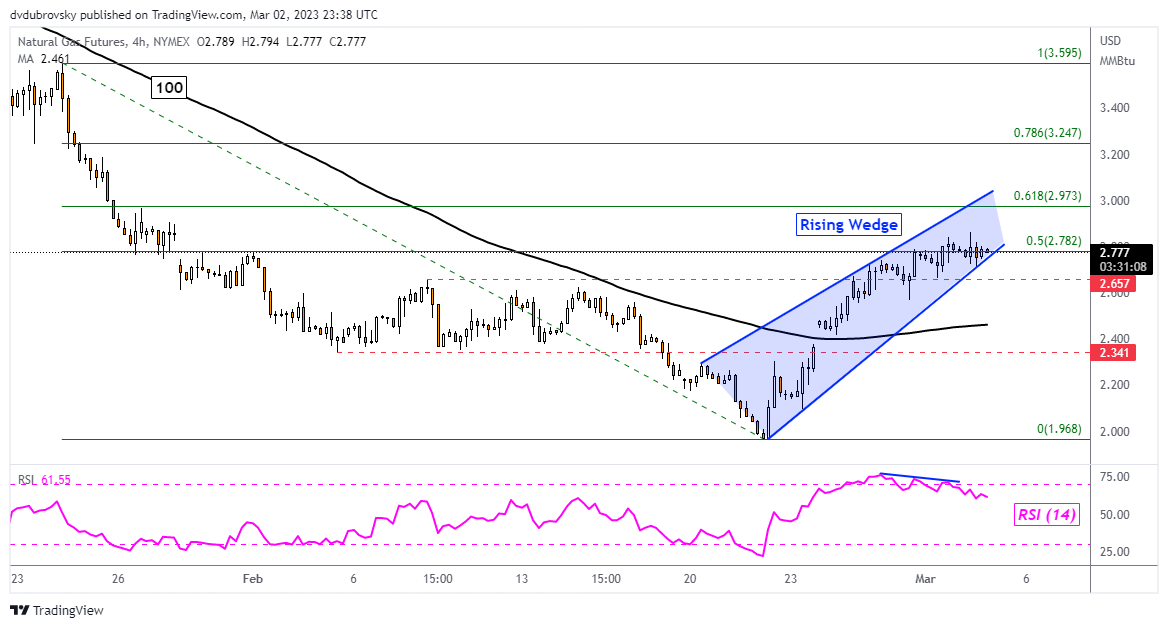
Chart Created Using TradingView
--- Written by Daniel Dubrovsky, Senior Strategist for DailyFX.com
To contact Daniel, follow him on Twitter:@ddubrovskyFX


