


S&P 500, Event Risk, USDJPY, Housing and GBPUSD Talking Points:
- The Market Perspective: USDJPY Bearish Below 146; EURUSD Bullish Above 1.0000; Gold Bearish Below 1,680
- Japan’s policy authorities intervened on USDJPY into the close of this past week in a bid to leverage thin liquidity into a significant market-based move
- Event risk will ramp up significantly in the week ahead from sentiment surveys to US and German GDP to FAANG earnings to ECB and BOJ rate decisions

Risk Trends are Expected to Pick Up Significantly On Seasonal and Systemic Developments
We have drawn to a close a period that was expected to struggle with speculative traction. While there were a few economic docket highlights and a number of unresolved backdrop themes, there was limited anticipation for the imminent development (or ‘revival’) of systemic trends. That is especially true given the scale of anticipation for the coming week’s docket. When it comes to the baseline of speculative appetite, the S&P 500 closed out the week with a 2.4 percent rally that would still ultimately fall comfortably within the week’s range. It was nevertheless a cap on a 4.7 percent charge on the week that defies the average performance form the US benchmark through the 42nd week of the year. Historical averages are historically relevant, but they do not well account for the environment from year to year. For US indices, what I’m looking for to signal a genuine recovery is either a holistic improvement in fundamental conditions or a flush on speculative exposure (for which I’m keeping a close eye on the 50 mark for VIX). We have seen neither thus far.
Chart of S&P 500 with Volume, 20-Day SMAs, 1-Day ROC and an Inverted VIX Overlay (Daily)
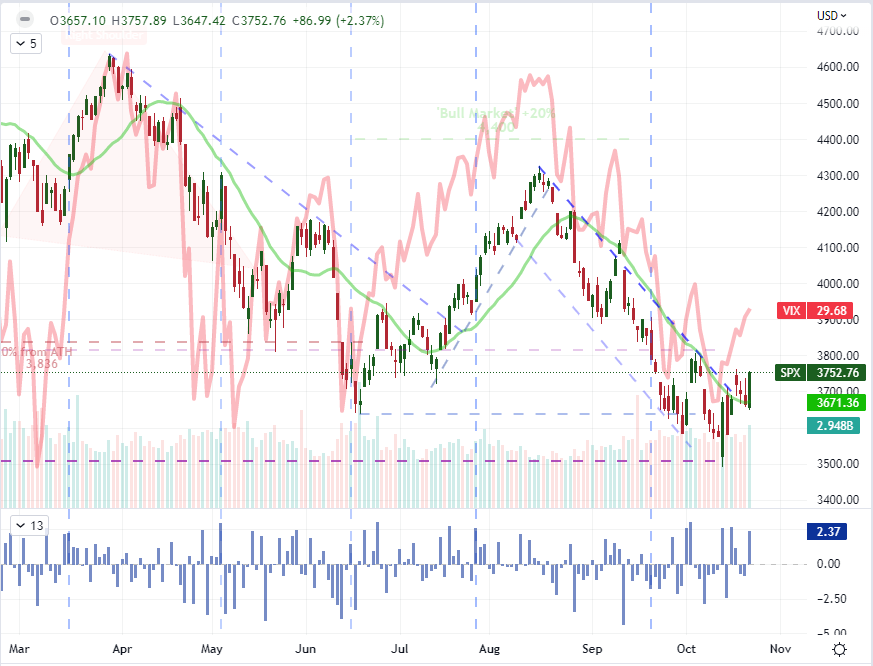
Chart Created on Tradingview Platform
Fundamentals and technicals are important to me in my analysis of assessment of the market’s course, but ‘conditions’ represents my first concern when evaluating the markets. Participation, a propensity towards volatility and general bias towards risk trends among the speculative rank can dramatically alter the way the markets move. There are some interesting norms ahead to consider from benchmark: we are closing out the month of October which typically renders the peak in both volatility and volume for the S&P 500; the 43rd week of the year has averaged a retreat from the historically averaged peak and the docket is lined with high profile event risk. Yet, a more innocuous development for those that tend to monitor the developed markets only, is the return of market depth in China. The country’s National People’s Congress is drawing to a close, and the cap on markets during the political gathering shouldn’t be surprising. It remains unclear when the Chinese authorities will release the 3Q GDP and September economic data reports delayed from last week, but the attention they will garner is unmistakable. In the meantime, USDCNH is still hovering near 14-year highs while the Chinese (FXI ETF) to US (Dow Index) ratio has experienced a steep divergence. I’ll be watching this week to see if those delayed fundamental beacons will be scheduled for release soon.
Chart of USDCNH with 20-Day SMA Overlaid with the Shanghai-Dow Ratio (Daily)
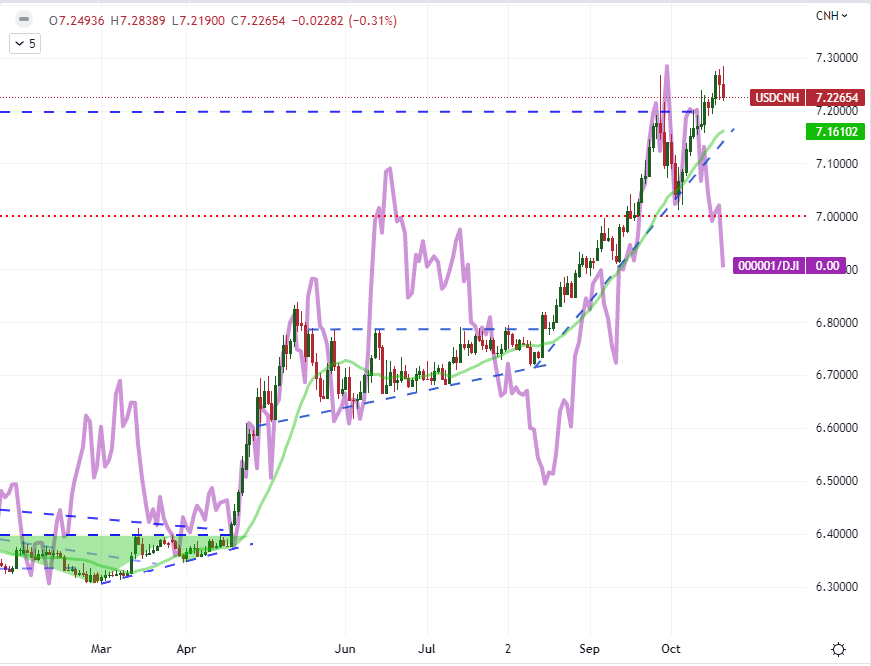
Chart Created on Tradingview Platform
Japanese Intervention Timed to Leverage the Market’s Listlessness
In an otherwise quiet end to the past week, a special word must be said about the volatility of the Japanese Yen. Up through Thursday’s close, the USDJPY exchange rate had advanced for 12 consecutive trading sessions – the longest run since 1973. If all that were necessary were for a single session’s correction to upend the focus, volatility would seem to have been disarmed this past Friday. The world’s second most liquid exchange rate unexpectedly dropped -1.7 percent through Friday to mark a stark reversal from the 152 level. It has been suggested that this move seems to align to the view that the Ministry of Finance in Japan were once again at work to curb the rampant depreciation (some would say ‘devaluation’). While there was greater influence by the policy hit this past session, it is worth noting that the central bank has suffered through an onerous climb. Furthermore, officials have yet to convince the G7 to help with exchange rate instability and Japan has refused to take the practical steps to close the policy gap with its largest counterparts. I will be watching closely at the open of next week to see whether some recent, technical breaks turn into trend or whether the fundamental focus is misaligned.

Chart of USDJPY with 20-Day SMA, 1-day Rate of Change and Consecutive Candles (Daily)
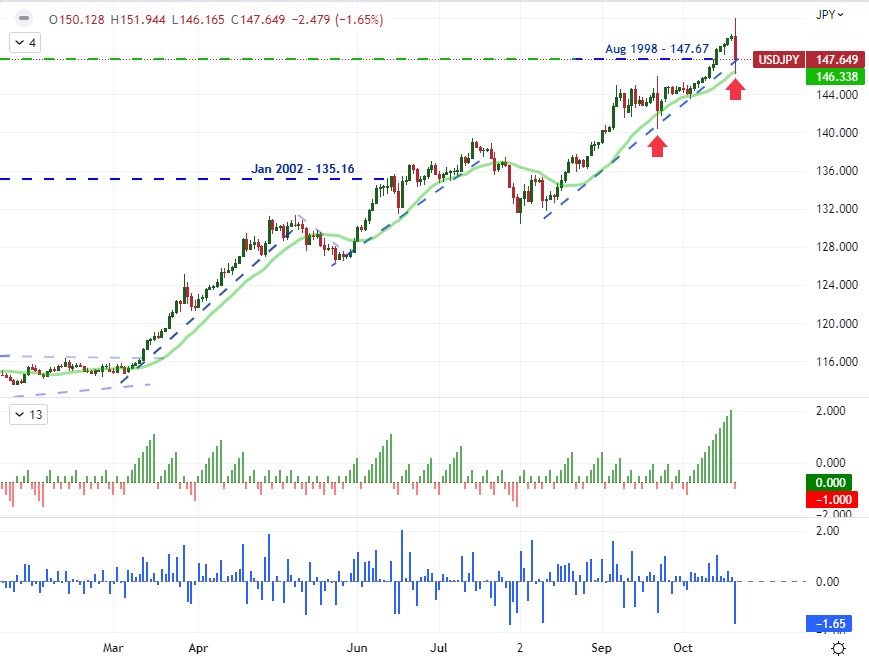
Chart Created on Tradingview Platform
Intervention is an outlier and ultimately a dubious influence at best. To truly turn a charge like USDJPY from it relentless climb to multi-decade highs, something more rudimentary may need to support the shift. Closing the gap on monetary policy courses between the Fed and BOJ could very well be the most effective steer on the exchange rate; yet the Federal Reserve has entered its media blackout period (two Saturdays before the FOMC meeting) with enough rhetoric to support a 75 bps hike at the November 2nd meeting – though debate over a moderation in tempo thereafter is picking up according to statements and Fed Fund futures. Sans the Japanese central bank surprising the world with an announcement that it is abandoning its yield curve control policy (extremely dovish) this week, USDJPY’s potential deflation will need to rest on a pullback in either risk trends or the Dollar itself.
Critical Macro Event Risk on Global Economic Calendar for Next Week
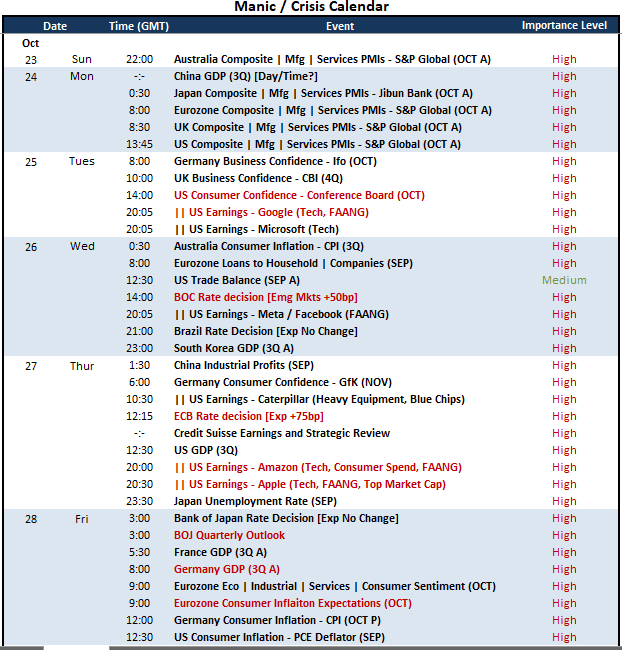
Calendar Created by John Kicklighter
Among the Top Themes: Monetary Policy Tops Growth and Earnings For Me
Usually, I have to dig into the shallow listings of top event risks for the week ahead to plot a trajectory for the markets-at-large. This time around, the docket is overflowing for event risk that can stir the markets to life. Setting aside the unscheduled influences like the BOJ’s subsequent intervention efforts, I will be watching some systemically important growth updates and earnings data for its ability to alter tap deeper fears. Growth is a particularly well-represented theme ahead between the US and Germany 3Q GDP readings to end the week as well as the timely October PMIs for the major developed world economies on Monday. Filling in the ‘middle’ of the week, we have FAANG earnings Tuesday through Thursday (after hours) as well as sentiment surveys for a number of major economies. It is unlikely that all of this aligns to the same ‘bullish’ or ‘bearish’ view of the course ahead; but if it does, the potential for momentum could prove profound.
Chart of Relative Monetary Policy Positioning of Major Central Banks
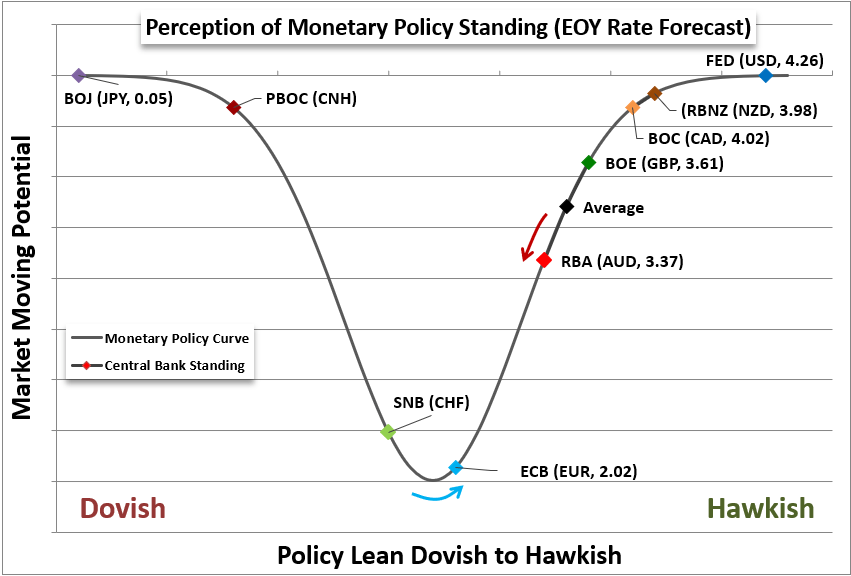
Chart Created by John Kicklighter
Between the economic event risk, the systemic questions raise through market conditions and a particularly engaging technical picture of its own; I will be paying attention to another FX major in the week ahead: EURUSD. While it doesn’t face the same kind of unpredictable – and thereby extreme – volatility potential as the USDJPY, it carries a convergence of influences that can render a significant move. A wedge has formed on the pair over the past three weeks, but the prevailing bear trend through 2022 is the dominant terrain feature. Volatility is far too high for the narrow trading range that we’ve seen develop over the past few weeks. Between PMIs, 3Q GDP figures, sentiment surveys, the ECB rate decision and a general discrepancy in risk standing; this is a loaded pair that should be on any FX observer’s radar.

Chart of EURUSD with 50-Day and 100-Day SMAs, and 10-Day ATR and Historical Range (Daily)
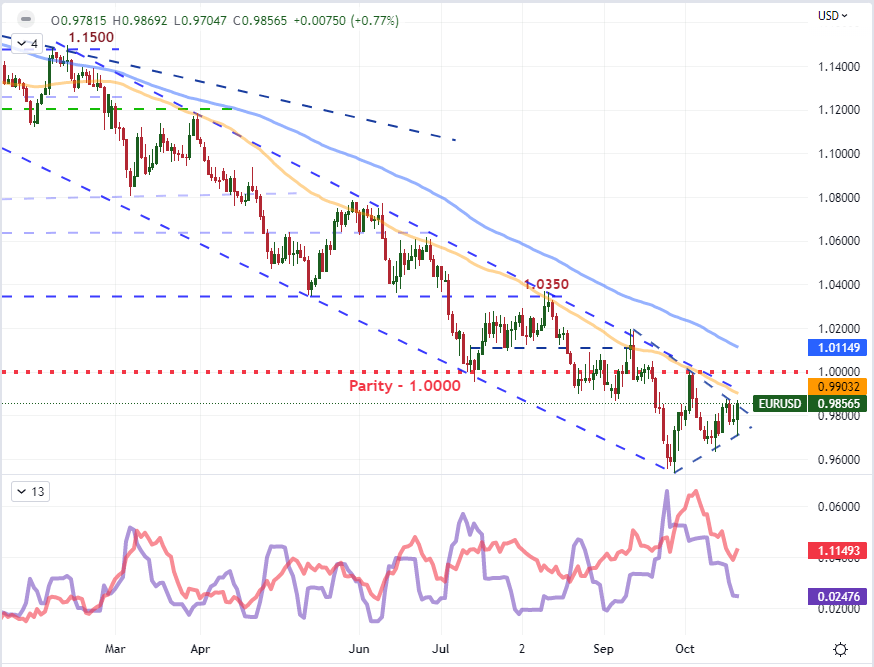
Chart Created on Tradingview Platform
Trade Smarter - Sign up for the DailyFX Newsletter
Receive timely and compelling market commentary from the DailyFX team


