


S&P 500, VIX, CPI Inflation, Dollar and USDJPY Talking Points:
- The Market Perspective: USDJPY Bearish Below 137; GBPUSD Bullish Above 1.2300; S&P 500 Bearish Below 4,030
- Monday was the ‘quietest’ day of the week, yet the New York Fed’s consumer inflation expectations update may have charged the S&P 500’s 1.4 percent climb
- While ‘risk’ assets may have firmed up, we are still well within meaningful ranges as the US CPI and FOMC combo usher in a broad and potent mix of macro event risk

If we had to tally up the events on the docket through this week, Monday would be the lull of the five-day period. That said, we were still dealing with a round of high-profile event risk that included Japanese 4Q business confidence, Chinese lending for November and a broad mix of important data from the United Kingdom. Yet the most disruptive listing may have been the New York Federal Reserve’s release of its Survey of Consumer Expectations for the month of November. An interesting report overall given that expectations can lead to action – hence why sentiment surveys are so important to watch – but the most interesting component of the measure for me was the inflation expectations gauge. There was a big drop in 1-year inflation expectations. In fact, it was the biggest drop in the survey’s records. And, where this survey may not be the most market moving indicator on its own, it feeds into the well of ‘inflation cooling’ data that we have seen these past weeks including last week’s PPI reading and the adjacent strength in the US nonfarm payrolls. It is that collective support that likely encouraged the S&P 500 to advance 1.4 percent on the day. Yet, where the climb was a substantial one statistically and given the surrounding inactivity; it did not resolve the technical consolidation we have been mired in. The past four-day range is still the smallest in percentage terms of 2022. But we will likely soon break this restrictive span.
Chart of the S&P 500 with 100 and 200-Day SMAs, 4-day Range and ATR (Daily)
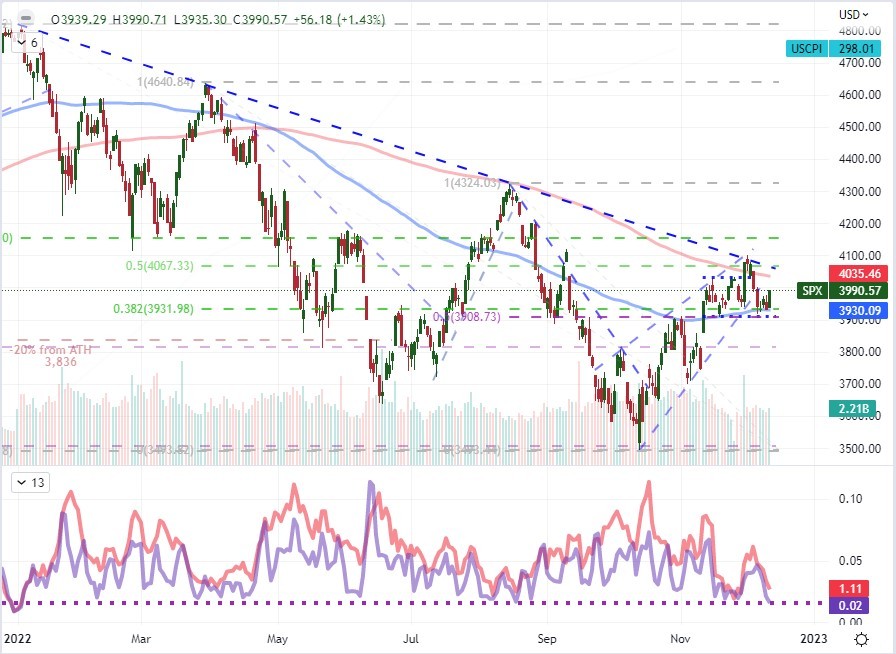
Chart Created on Tradingview Platform
Typically, when there is a rise in the S&P 500 or other risk-leaning benchmark, we expect a drop in the so-called ‘fear gauge’. The VIX volatility index’s inverse correlation to its underlying equity benchmark is exceptionally strong as the options it is derived were historically used as hedge to the underlying. That said, there is plenty of speculative appetite for projecting the rise and fall of volatility itself nowadays. For the VIX, Monday saw a massive gap to the upside and subsequent follow through that pushed it back up to 25. The nearly 10 percent increase in the index (or 2.2 points – I don’t usually like percentages on such measures) was a distinct contrast from the normal relationship to the index. In fact, this represented the biggest tandem rally charge in the S&P 500 and VIX since May 5th, 1997. The prompt for this unusual alignment: anticipation for the enormous event risk ahead.
Chart of the VIX Volatility Index and 1-Day Rate of Change (Daily)
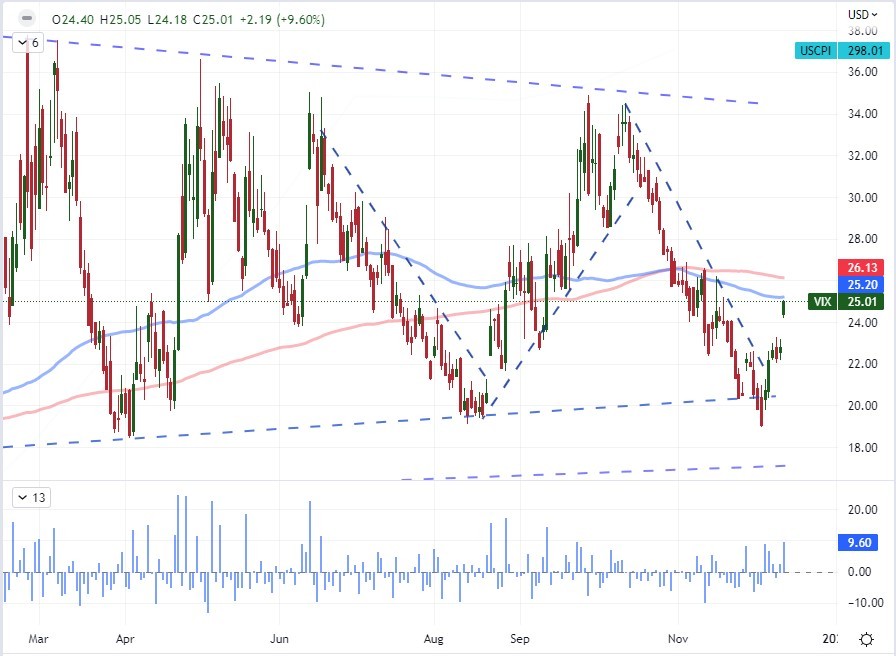
Chart Created on Tradingview Platform
Looking at the macroeconomic docket for the next few days, there is good debate to be had over whether the reaction of Tuesday’s top listings can garner enough traction to override the anticipation for Wednesday’s FOMC rate decision. Historically-speaking, there is a distinct advantage to the rate decision’s impact on benchmarks like the US indices and Dollar versus the inflation report. It is also worth considering that price pressures are so important to the market’s adjustment because it feeds into rate expectations. However, there is no mistaking the critical reaction from the markets to the November 10th release of the October CPI report. It seems that the market expects volatility one way or the other. Perhaps this will be a week that is unconventionally range-bound specifically because of the offsetting signals of reaction and anticipation…
Top Macro Economic Event Risk for Next Week
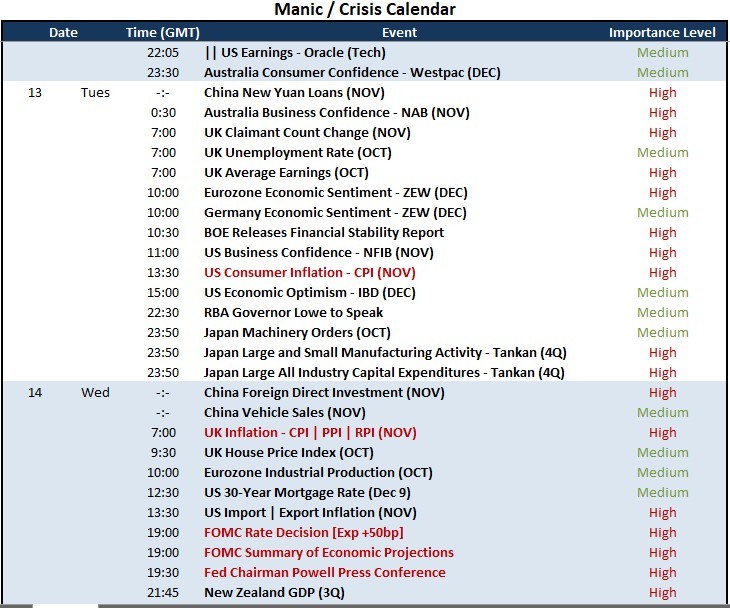
Calendar Created by John Kicklighter
While many traders are principally interested in the short-term response to the upcoming CPI and subsequent FOMC updates, it is worth also considering the medium-to-long term implications. Inflation pressures do seem to be cooling meaningfully. The New York Fed’s findings for inflation one year ahead showed a record-breaking 0.7 percentage drop to a 5.2 percent clip. That satisfies those that believe price growth will quickly come back into the range of comfort for the central bank – and avoid a recession – but these levels are still extremely high. In reality, the BLS’s consumer price inflation report draws a lot more attention from investors and policymakers alike. That said, this series could override or more meaningfully amplify market response should it come with surprise. If it indeed does reinforce those expectations with a significant slowdown, the Dollar’s medium-term slide may extend as the carry trade appeal further cools.
Chart of the DXY Dollar Index Overlaid with US CPI and NY Fed’s Consumer Inflation Exp (Monthly)
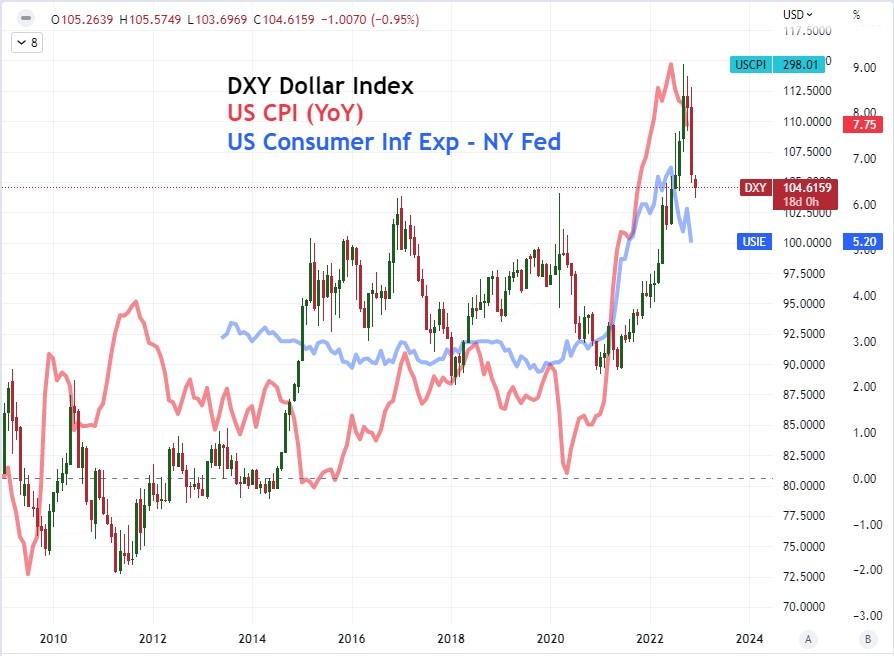
Chart Created on Tradingview Platform
For a more short-term view on the Dollar side for out the inflation statistics are landing, it is important to consider the USD crosses wisely. Despite its heft in pairings like AUDUSD, NZDUSD and USDCAD; there hasn’t been much in the way of productive Dollar run – particularly when the Greenback has mounted rebounds. That is a one-sided reaction potential. Meanwhile, EURUSD and GBPUSD look good technically with very narrow ranges to trade within, but the added expectation for the ECB and BOE decisions on Thursday will add another layer of complication into an already fundamentally convoluted picture. USDJPY is perhaps one of the more succinct reflections of the upcoming event risk. There is a narrow technical range between the 137.50 former support as new resistance and the 200-day moving average as a hastily rising floor. Be wary, however, there is both a carry and ‘safe haven’ aspect that can compete for this pair’s fealty.
Chart of the USDJPY with 20 and 200-Day SMAs (Daily)
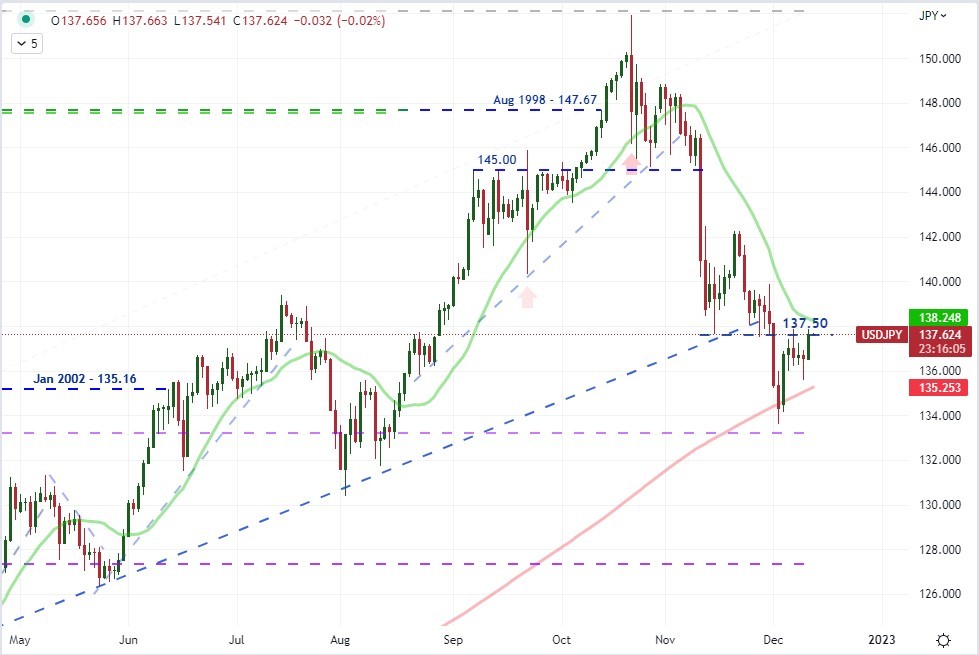
Chart Created on Tradingview Platform


