


NASDAQ, DJI, S&P 500 Latest
- US equity futures turn positive while volume subsides
- Nasdaq lags as tech stocks monitor China restrictions as descending triangle holds
- Dow Jones rises above Fibonacci support while a softer USD drives gains
Read: S&P 500 a Volatility Risk While the Dollar Falls Back to a Reliable Theme: Fed Hikes

Nasdaq 100, S&P 500 and Dow Jones are trading higher despite growing fundamental risks. Despite news that China restrictions will remain intact for the foreseeable futures, positive earnings from Analog Devices (ADI) and an uptick in profit margins for Best Buy (BBY) provided some relief for Nasdaq which is lagging its US counterparts.
With the Thanksgiving holiday shortening the US trading week, durable goods orders, Michigan sentiment and the FOMC minutes could still provide a catalyst for US stock indices.
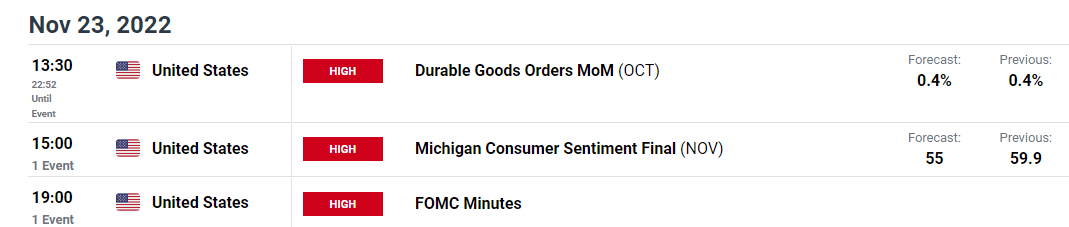
DailyFX Economic Calendar
With interest rate forecast predicting an 81% probability of a 50bps interest rate hike at the December Fed meeting, fundamentals remain key for assessing the resilience of the US economy.

Nasdaq 100 Technical Analysis
For tech heavy Nasdaq 100, price action continues to grapple the Fibonacci retracement of the ’20 – ’21 move providing resistance around 11700. As demonstrated on the weekly chart below, the the full-bodied candles that developed throughout June and July highlighted a strong zone of resistance which has come back in play.
After the 10 November CPI (consumer price index) print fueled a bull rally, a rejection of the upper wick at 12118 drove Nasdaq 100 futures lower before opening the week at 11723.
Nasdaq 100 Weekly Chart
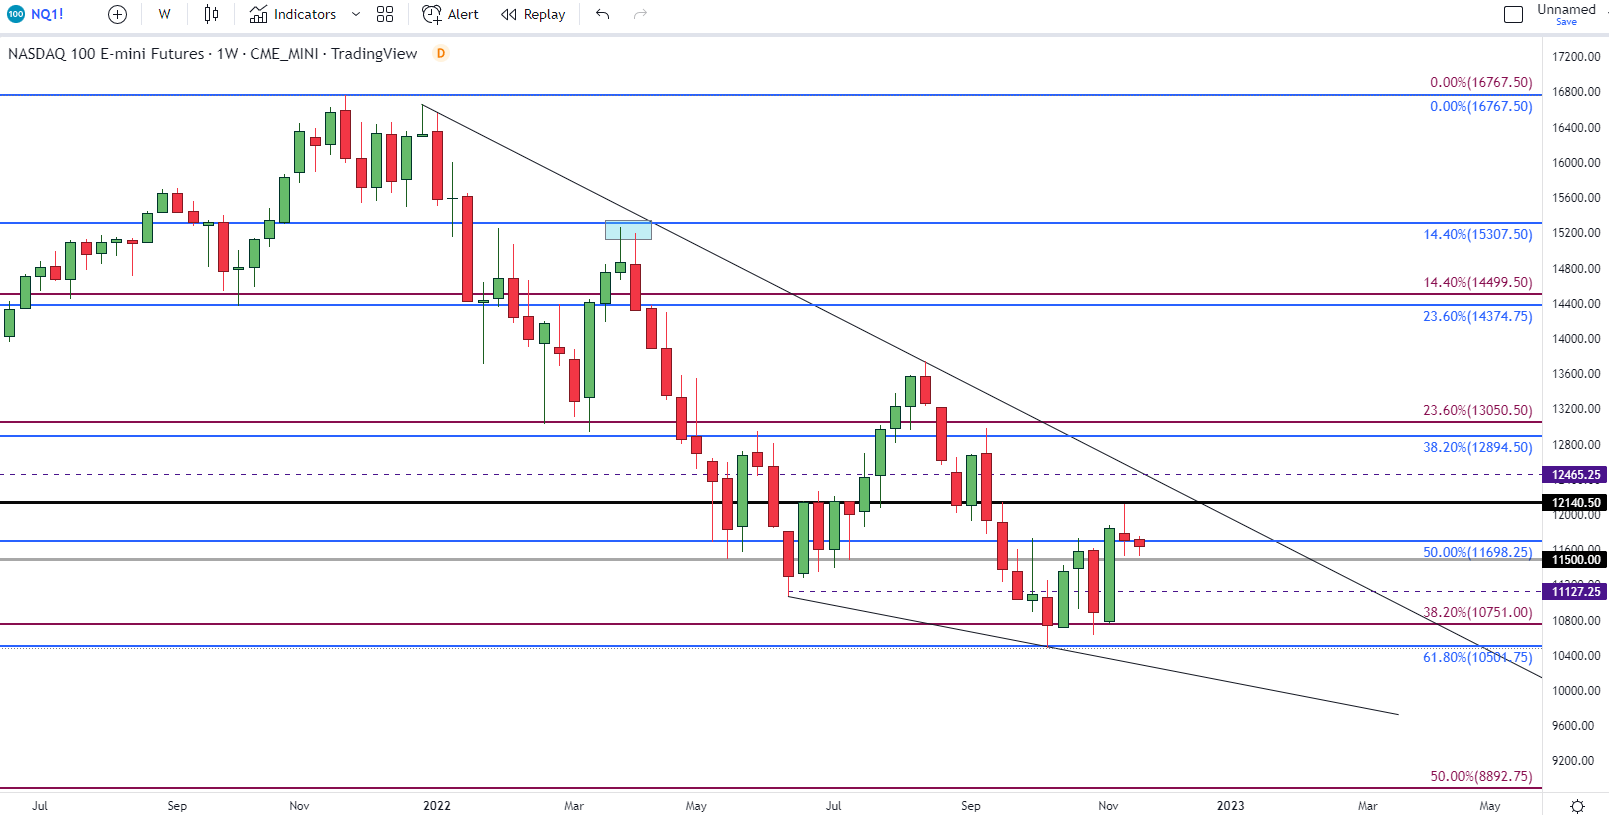
Chart prepared by Tammy Da Costa using TradingView
For bullish momentum to hold, a break of 17000 and 11728 could drive prices back towards the November high at 12118. As volume decreases, a drop below 11500 could fuel the downside move.
Nasdaq 100 Daily Chart
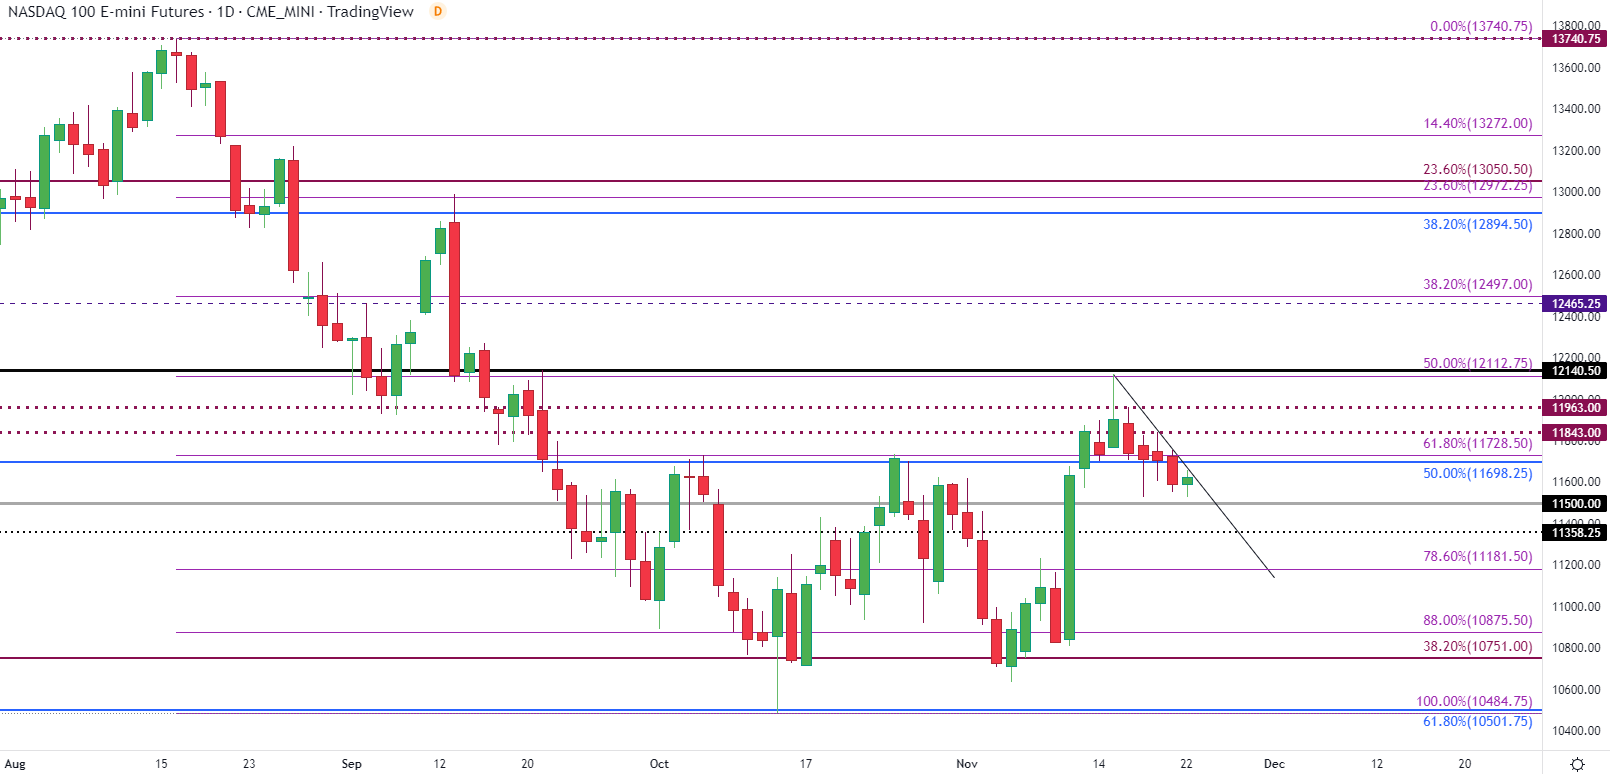
Chart prepared by Tammy Da Costa using TradingView
With Dow Jones continuing higher, the 34000 handle could continue to hold steady while a move higher paving the way for the August high of 34246.
Dow Jones Future Daily Chart
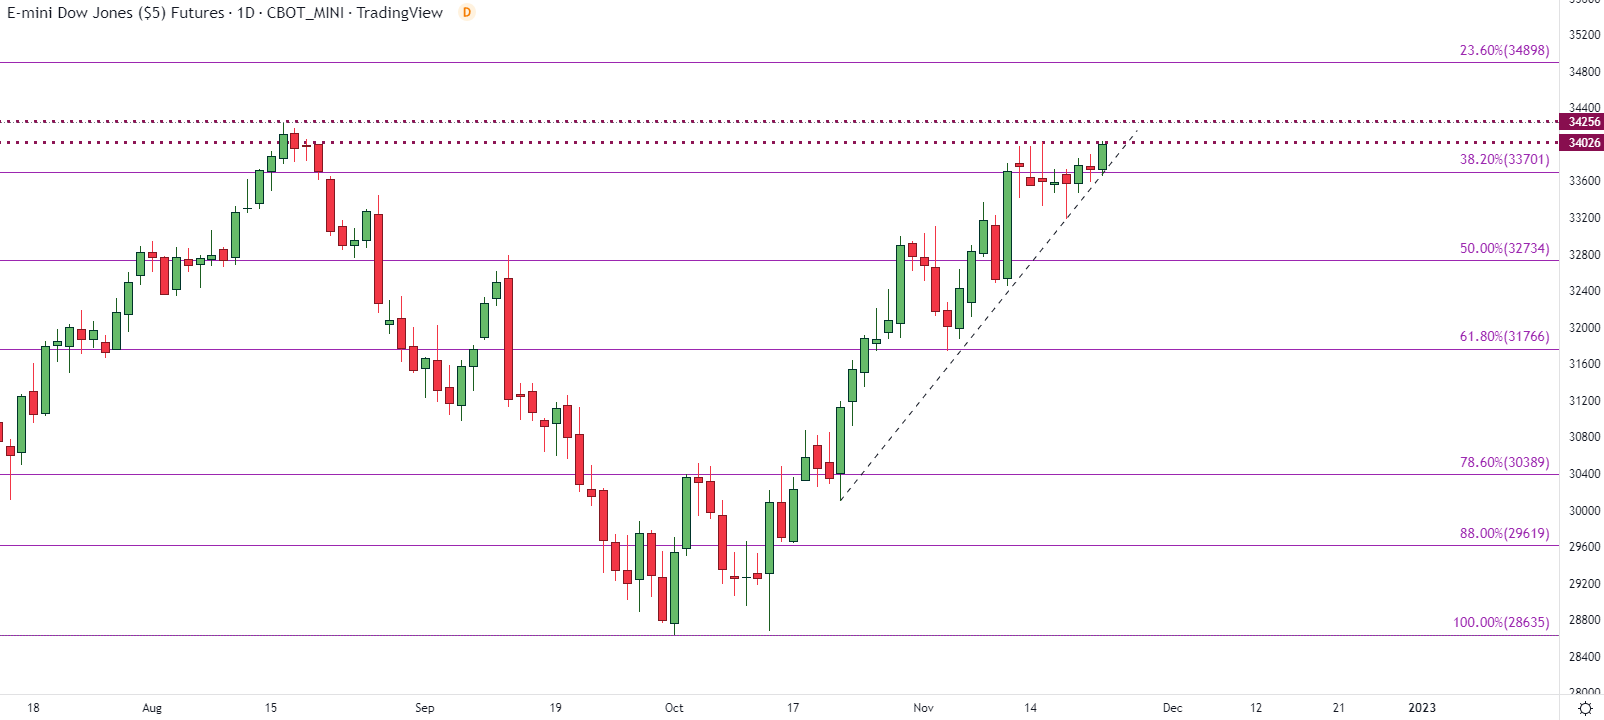
Chart prepared by Tammy Da Costa using TradingView
| Change in | Longs | Shorts | OI |
| Daily | -18% | 18% | 7% |
| Weekly | -19% | 14% | 4% |
--- Written by Tammy Da Costa, Analyst for DailyFX.com
Contact and follow Tammy on Twitter: @Tams707


