


S&P 500, Dollar, Fed Forecast, Recession Risks and Liquidity Talking Points:
- The Market Perspective: USDJPY Bullish Above 141; EURUSD Bullish Above 1.0000; Gold Bearish Below 1,750
- The S&P 500’s range Monday was the smallest in three months: a historical comparison to a period that preceded a significant technical break
- Thanksgiving liquidity will be a certain influence ahead, but that doesn’t mean the market’s will simply freeze in place…just look at the Dollar’s developments

We have entered a week whereby there is a known throttle on activity: the well-known impact of the Thanksgiving holiday in the US on broader markets. Liquidity and volatility do not always enjoy a positive correlation, but quiet conditions without provocative fundamental updates can lull market participants into a comfortable holding pattern. That seems to be the tempo that the markets were aiming for to start this week. As the World Cup tournament distracted many traders, the benchmark S&P 500 (one of my preferred, imperfect measures of ‘risk’) carved out an exceptional small trading range. The less-than-24 point range through the session represented the smallest day’s stretch as a percentage of spot since August 18th. For the chart observer, that happens to be the end of consolidation following a bullish leg over July into August. Many may focus on the change in direction – which was meaningful – but I believe the escalation of activity is more reliable a comparison. These are exceptionally small trading ranges, both for the Monday session and the past 7-day chop; and the risk of a volatility spurred by thin liquidity is likely very high. Yet, if such a break occurs before the holiday; follow through will just as readily be stymied by the absence of liquidity during the US session Thursday.
Chart of the S&P 500 with 100 and 200-Day SMAs and 1-Day Historical Range (Daily)
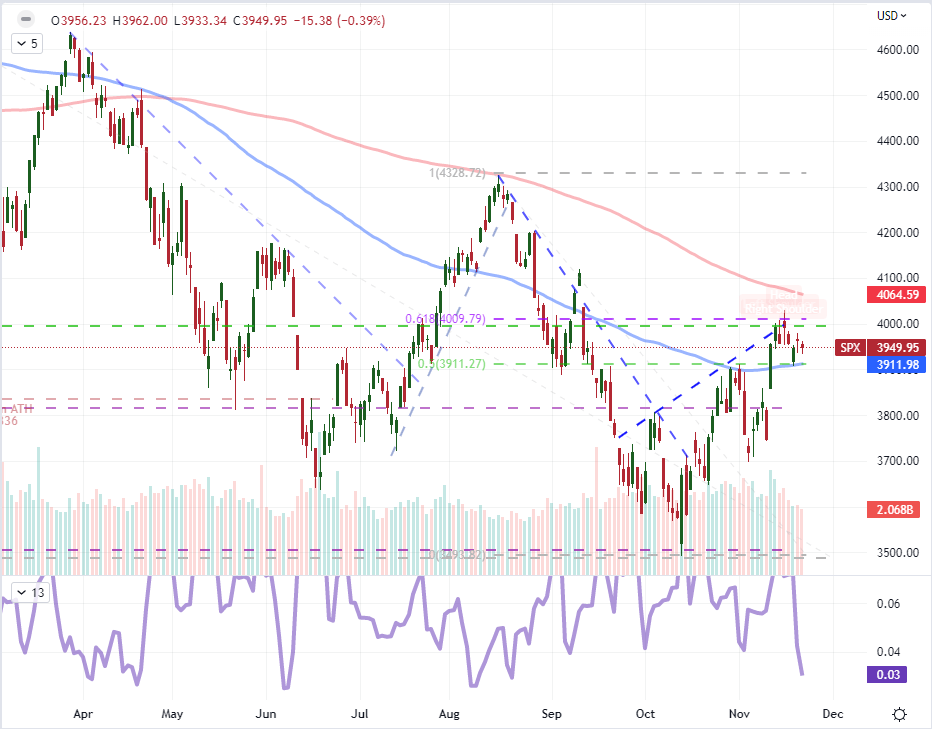
Chart Created on Tradingview Platform
While many ‘risk’ leaning assets were struggling with generating any meaningful heat in active trade this past session, there was a notable outlier in terms of traction. The US Dollar managed to earn a significant bounce through the past session. And, while it wasn’t a record-breaking charge by any stretch, it represented one of the biggest single day climbs we have seen since the market started to truly question the prevailing trend. This would lead to an interesting capitulation of the bull leg from EURUSD after it failed to hold above 1.0350 as well as USDJPY extending its rebound above 141 – and put the pressure back on Japanese policy authorities that failed to garner traction in previous months through active intervention on behalf of the Yen. There was similarly interesting progress to be registered in key commodities priced in Dollar, like Gold which has accelerated in its four-day slide. In contrast, crude oil was under serious duress through the first half of Monday’s session, but managed to reversal most of its losses and wrestle a recovery away from the Greenback.

Chart of the DXY Dollar Index Overlaid with the Implied June 2023 Fed Funds Rate (Daily)
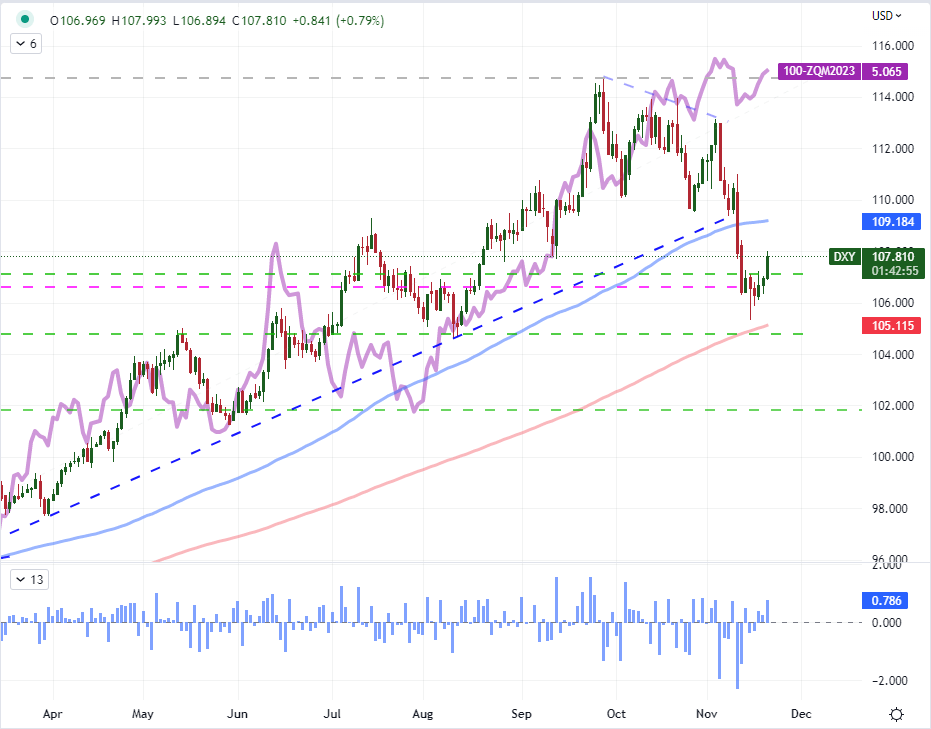
Chart Created on Tradingview Platform
What is moving the Dollar where the broader capital markets are struggling? Fundamental motivation. While the economic docket was very light to open this week, there nevertheless remains an active speculation around interest rate expectations. The discount exacted on the Dollar after the October CPI release two weeks ago seems to have run significantly further than the actual expectations for interest rates measured by Fed Funds futures or other similar measures. With Fed officials like Loretta Mester offering comments such as she believes the central bank is ‘nowhere near’ the end of its tightening regime, it is no surprise that there is some active rebalancing of fundamental assumptions through the Dollar. That said, rate forecasting is still an open-ended theme founded more on the balance of speculation through products like Treasury yields than it is scheduled data – as there isn’t much over the coming session that will tip the balance here sans central bank speak. That said, there may be more weight afforded to recession fears through these next 48 hours.
Critical Macro Event Risk on Global Economic Calendar for the Next Week
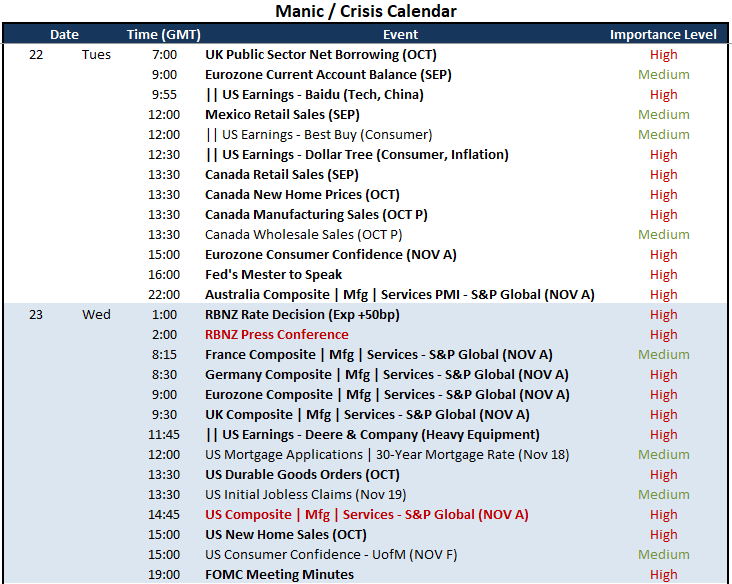
Calendar Created by John Kicklighter
While we are facing further central bank rhetoric through the coming session – including the Fed’s top trio of hawks in Mester, George and Bullard – the focus is likely to shift onto economic forecasting – or more appropriately, recession assessment. This past session, saw a deepening inversion of the investor-monitored 2-year to 10-year Treasury yield curve. As of Monday’s close, the negative figure is the deepest seen in four decades. Further evidence of economic pain isn’t necessary, but he Chicago Fed’s National Activity survey for October furthers a trend in data punctuated by Friday’s Conference Board Leading Economic index. We will see the most prominent, time sensitive look into developed world economic activity with Wednesday’s PMIs release; but for the time being the market is willing to operate on complacency. What happens when the market is more accepting of an impending recession; and what will solidify that that painful outlook?
Chart of the Average Weekly Performance of the S&P 500 by Calendar Year back to 1900
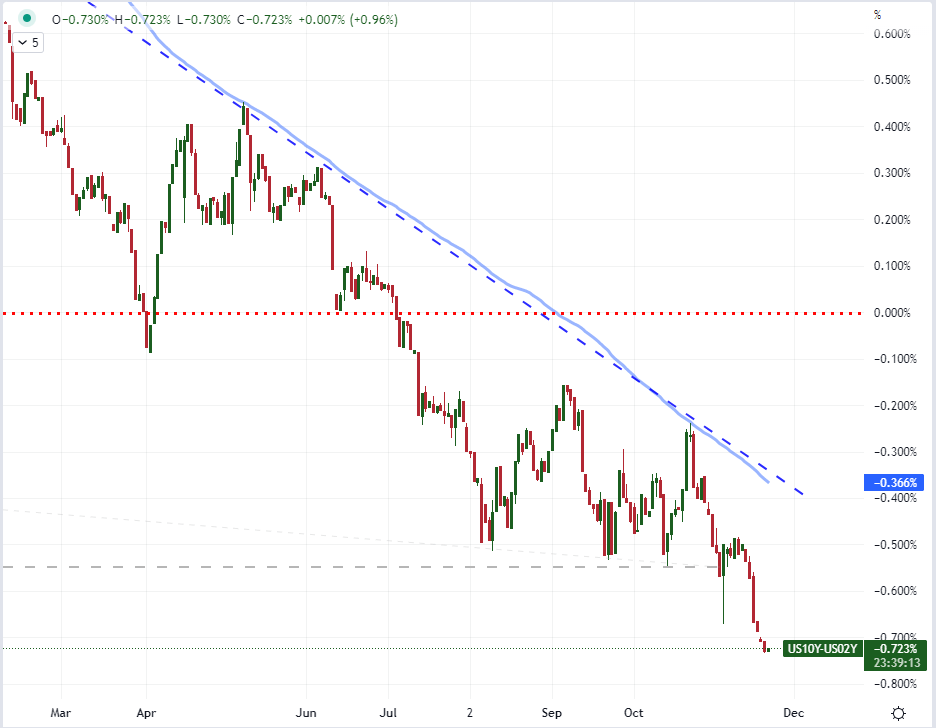
Chart Created on Tradingview Platform
Trade Smarter - Sign up for the DailyFX Newsletter
Receive timely and compelling market commentary from the DailyFX team


