


S&P 500 Talking Points:
- This morning brought a sizable breakout to the S&P 500 that’s been entirely erased.
- Inflation printed well-below expectations which gave bulls a sugar rush to run off of, but there’s now an elongated upper wick sitting atop price on the daily chart, the mirror image of what showed on the underside of price after an inflation print a couple months ago.
- The analysis contained in article relies on price action and chart formations. To learn more about price action or chart patterns, check out our DailyFX Education section.

The S&P 500 put in a sizable breakout ahead of the US open this morning, running-higher after the release of CPI data for the month of November. And once again, CPI printed below expectations, similar to last month, and this gave bulls a strong shot-in-the-arm as price breached the 2022 bearish trendline on the way to setting a fresh three-month-high.
That strength could not maintain, however, as price has pushed right back to pre-release levels.
S&P 500 30-Minute Chart: CPI Breakout, Reversal
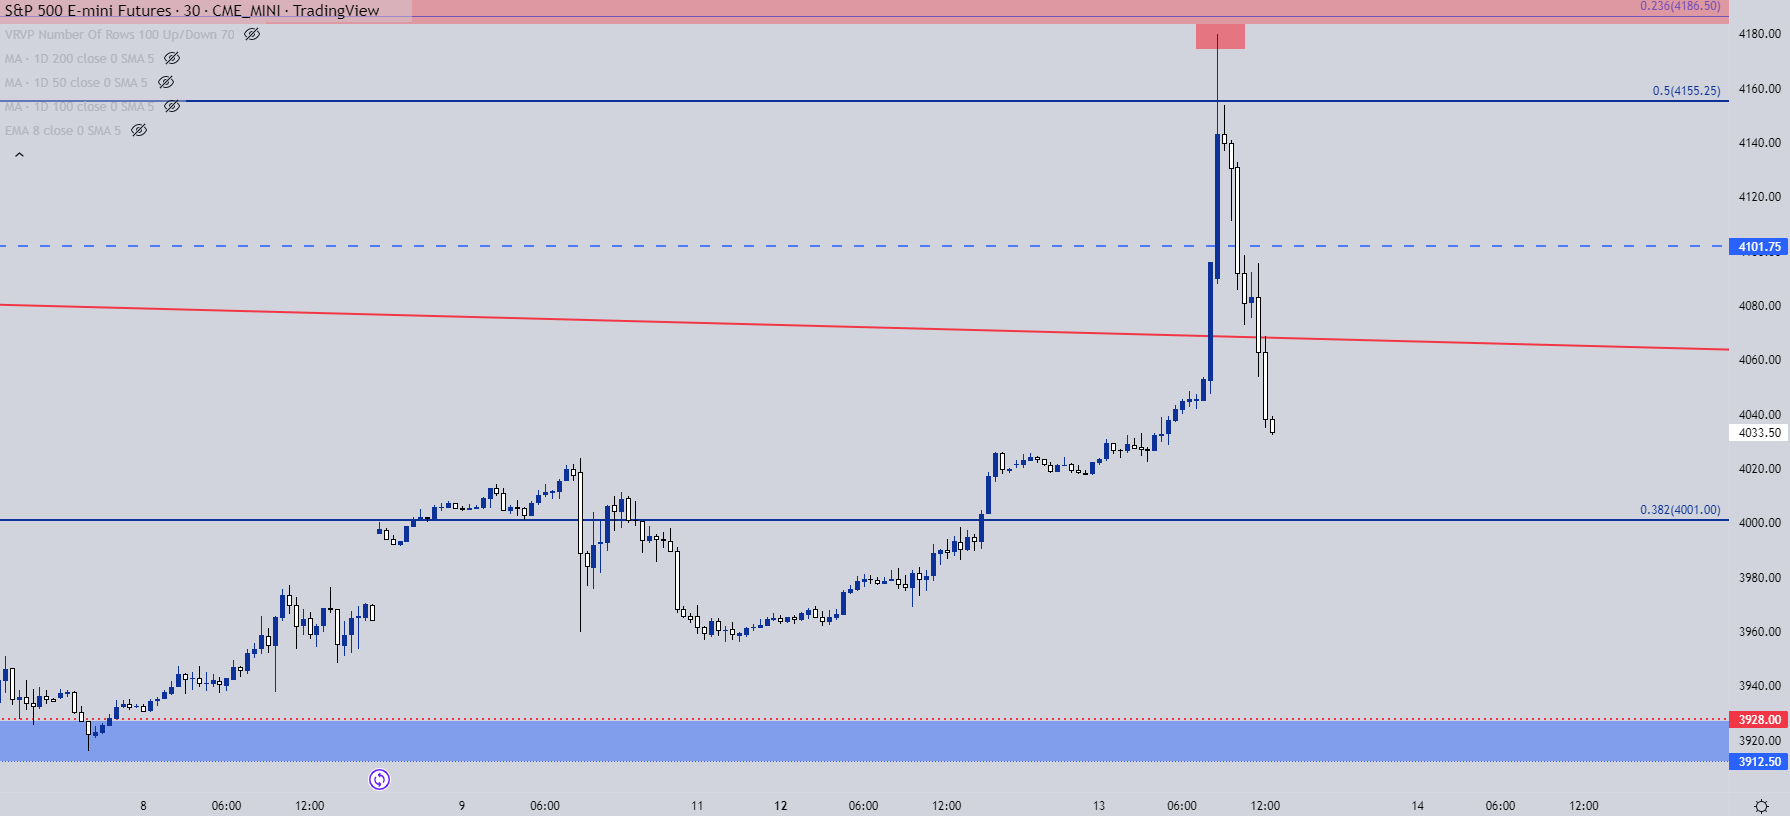
Chart prepared by James Stanley; S&P 500 on Tradingview
CPI Impact on SPX
I had looked into this yesterday but the past two CPI prints have had a massive impact on the S&P 500. The CPI print two months ago is what helped to mark the low, released on October 13th and the initial reaction was violent as prices pushed down to the 3500 spot on the chart. This is a key area as that level marks the 50% mark of the pandemic major move.
A strong response to that support left an elongated lower wick sitting below those candles, as bulls started to take control of the matter.
Bulls got another lifeline in November after another CPI print. Prices had broken out of a short-term falling wedge on the day of that release, leading to another string of higher-highs and lows that maintained until price action re-tested the 2022 bearish trendline.
This morning’s reaction is beginning to look like the mirror image of the October reaction…
S&P 500 Daily Chart
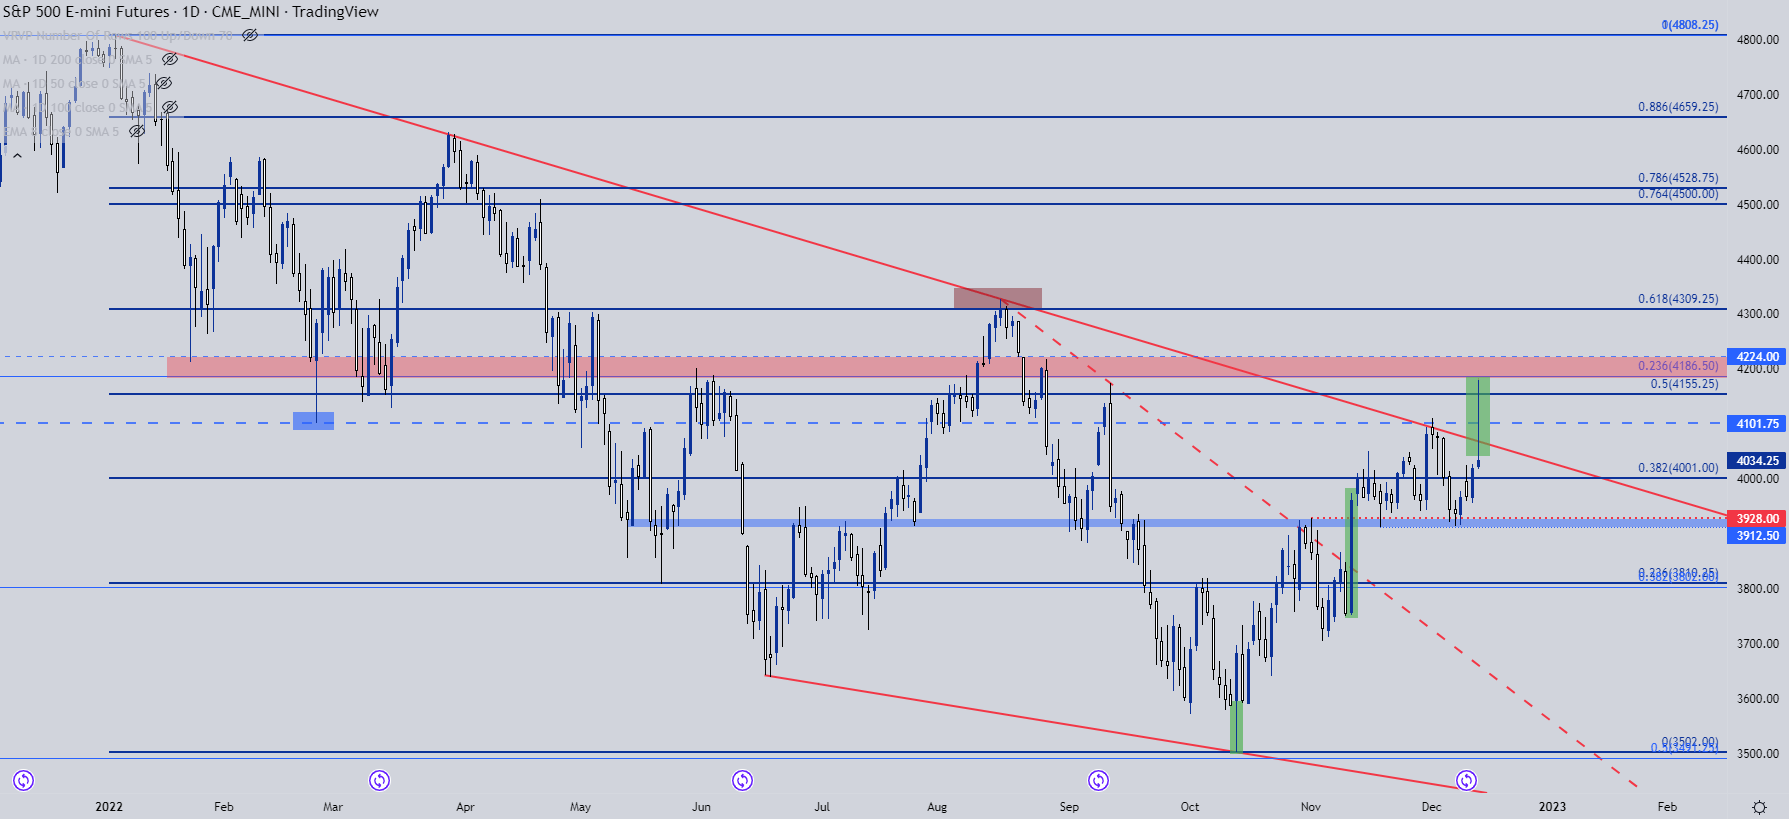
Chart prepared by James Stanley; S&P 500 on Tradingview
SPX: Focus Shifts to FOMC
At this point the Fed remains somewhat hawkish, albeit less so than what we’ve seen for much of this year. And while that hawkishness has led to bearish behavior in stocks this year, sentiment has become more of an issue as a heavily short market in June and then again in October led into counter-trend pullbacks that lasted for multiple months.
For tomorrow, the big question is the Fed’s projections along with Jerome Powell’s tone. We’ve seen two versions of Powell this year: The wordsmith that has something for both the hawks and doves (such as we saw a couple of weeks ago) and then the shorter, more concise Powell that showed up at Jackson Hole.
Markets are starting to look for a pivot next year and not a pivot to slower rate hikes, but pivots to possible rate cuts. The Fed has avoided this topic throughout the year because inflation still remains too elevated, illustrated again by this morning’s 7.1% headline read and 6% reading on core. And as US data remains somewhat strong, as shown by last Friday’s PPI and Consumer Sentiment report, the Fed still may have more work to do before inflation is nearing target.
Regarding the S&P 500, I had looked into this topic in this week’s forecast, highlighting the possibility of breakout from the falling wedge that’s taken all of 2022 to build. Well, that happened this morning, and price has snapped back far quicker than I had thought. I was anticipating that the bearish theme may have to wait until Q1 of next year, given the potential for a ‘Santa rally’ after the break of that falling wedge.
But if sellers can evoke a push back below the 4k level that theme may get started earlier than anticipated. An elongated wick of this nature doesn’t appear often on the daily chart and when it does, similar to what showed two months ago, it can open the door for reversal themes as a sign of possible capitulation.

S&P 500 Daily Chart
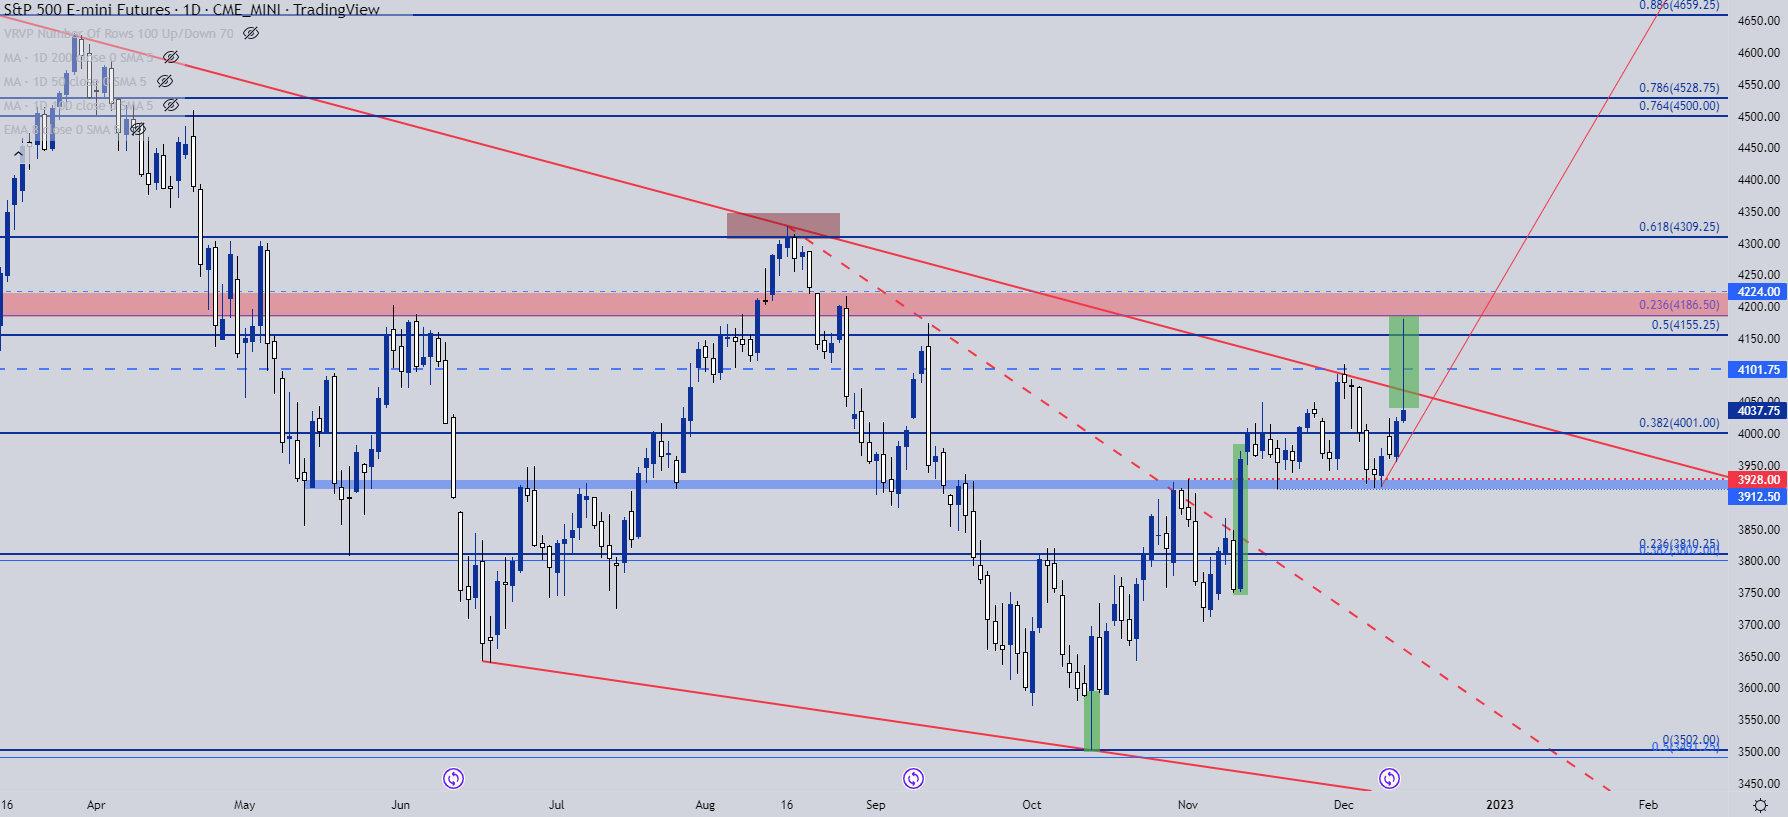
Chart prepared by James Stanley; S&P 500 on Tradingview
--- Written by James Stanley, Senior Strategist, DailyFX.com & Head of DailyFX Education
Contact and follow James on Twitter: @JStanleyFX


