


USD, Gold, EUR/USD Talking Points:
- This morning brought the release of CPI data out of the US for the month of October.
- The data came in well-below expectations, with Core CPI coming in at 6.3% against an expectation of 6.5% and headline CPI printing at 7.7% versus an 8.2% expectation.
- This has led to a massive move already, with an instant fall in the US Dollar that helped to push EUR/USD back-above parity. Equities have put in a major move ahead of the US open after falling down to key supports yesterday.
- The analysis contained in article relies on price action and chart formations. To learn more about price action or chart patterns, check out our DailyFX Education section.

Macro narratives shift quickly and the past two days have been an excellent example of that. Just yesterday there was growing concern of contagion as major crypto exchanges came under fire. The S&P 500 broke below a rising wedge formation and threatened to move back into the bearish trend. The Nasdaq broke a bull flag and the US Dollar was jumping after a support test.
But, as I highlighted in US Dollar Price Action Setups yesterday, EUR/USD was putting in strains of recovery and given the massive 57.6% allocation of the Euro in the DXY quote, that made for a large factor of contention for the Greenback.
After posing a support bounce yesterday, sellers have struck and prices in DXY are now pushing down to fresh monthly lows, crossing a key area of confluent support along the way. Today’s daily candle will be key, as it’s currently working on a bearish engulfing formation. And if that can continue, with price closing below those supports, the door will remain open to bearish continuation scenarios, with focus on deeper long-term supports around 107.79 and then, even longer-term, around 105.00.
Today’s daily bar close will be important as we’re still in the immediate aftermath of the CPI print at this point, and the reaction through today will be telling towards how market participants will incorporate this new data.
From the monthly chart below, we can see price falling down to another Fibonacci retracement level plotted at 108.75, which is the 76.4% retracement of the 2001-2008 major move.
US Dollar Monthly Chart
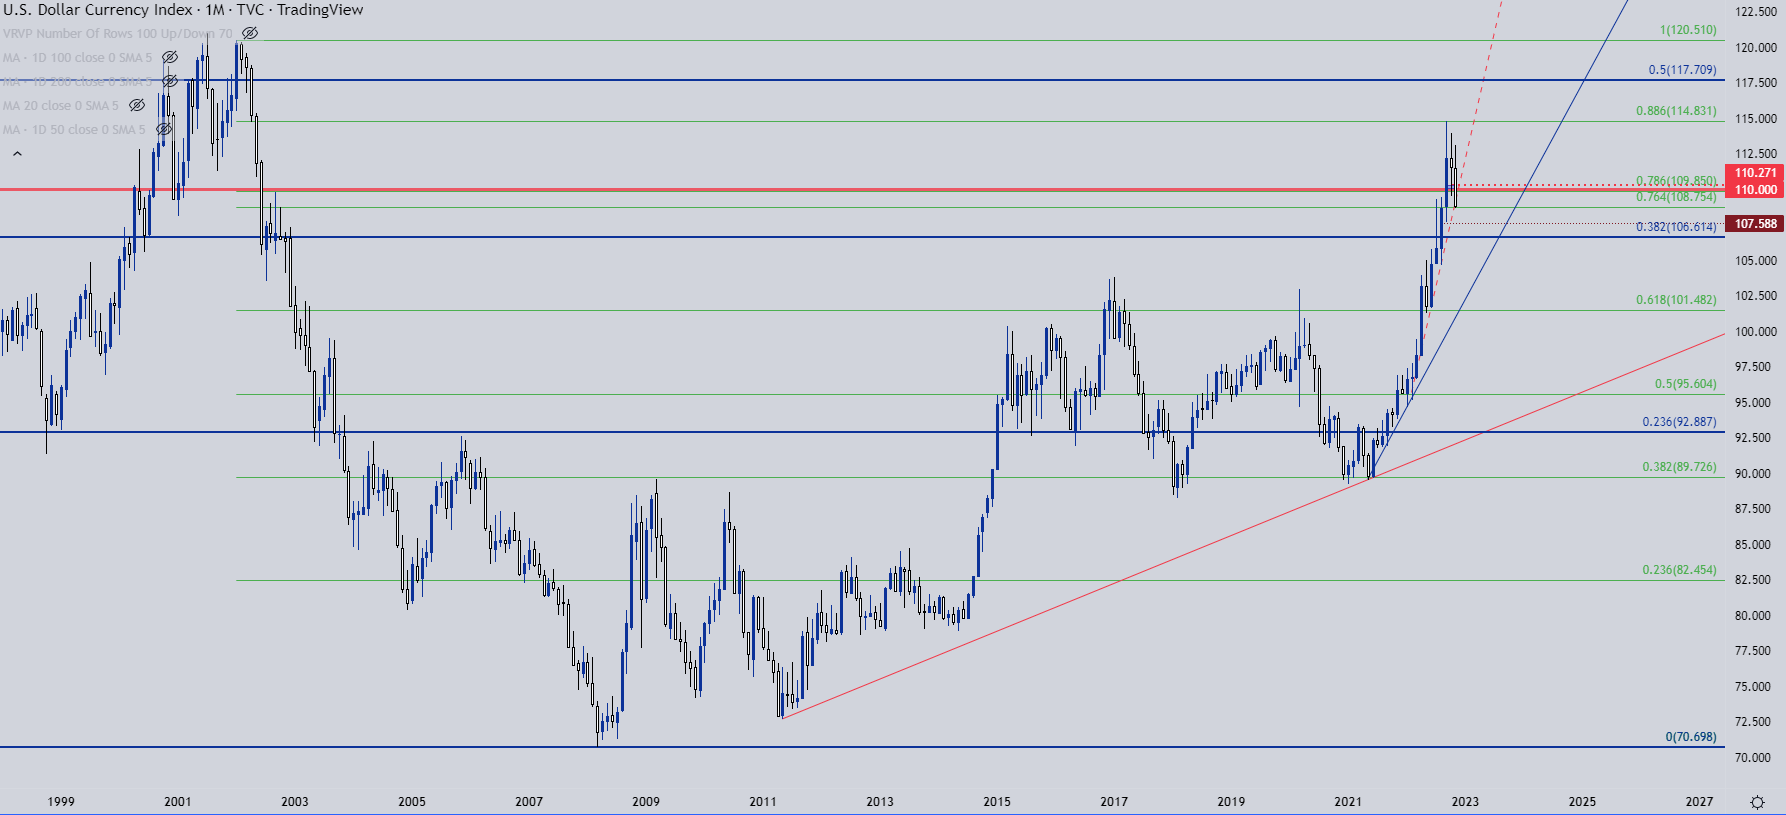
Chart prepared by James Stanley; USD, DXY on Tradingview
USD Shorter-Term
From the daily, we can see the bearing engulf formation that’s attempting to build. If today completes with the formation still in-place, that points to bearish momentum with next focus on prior price action swings at 107.79 and 105.00, with a Fibonacci level at 106.61 along the way.
Now, as to whether that continues, that likely depends on whether EURUSD bulls are willing to bid the currency pair to fresh highs, and that remains to be seen as bullish runs in that pair have been somewhat limited when testing above the parity handle.
US Dollar Daily Price Chart
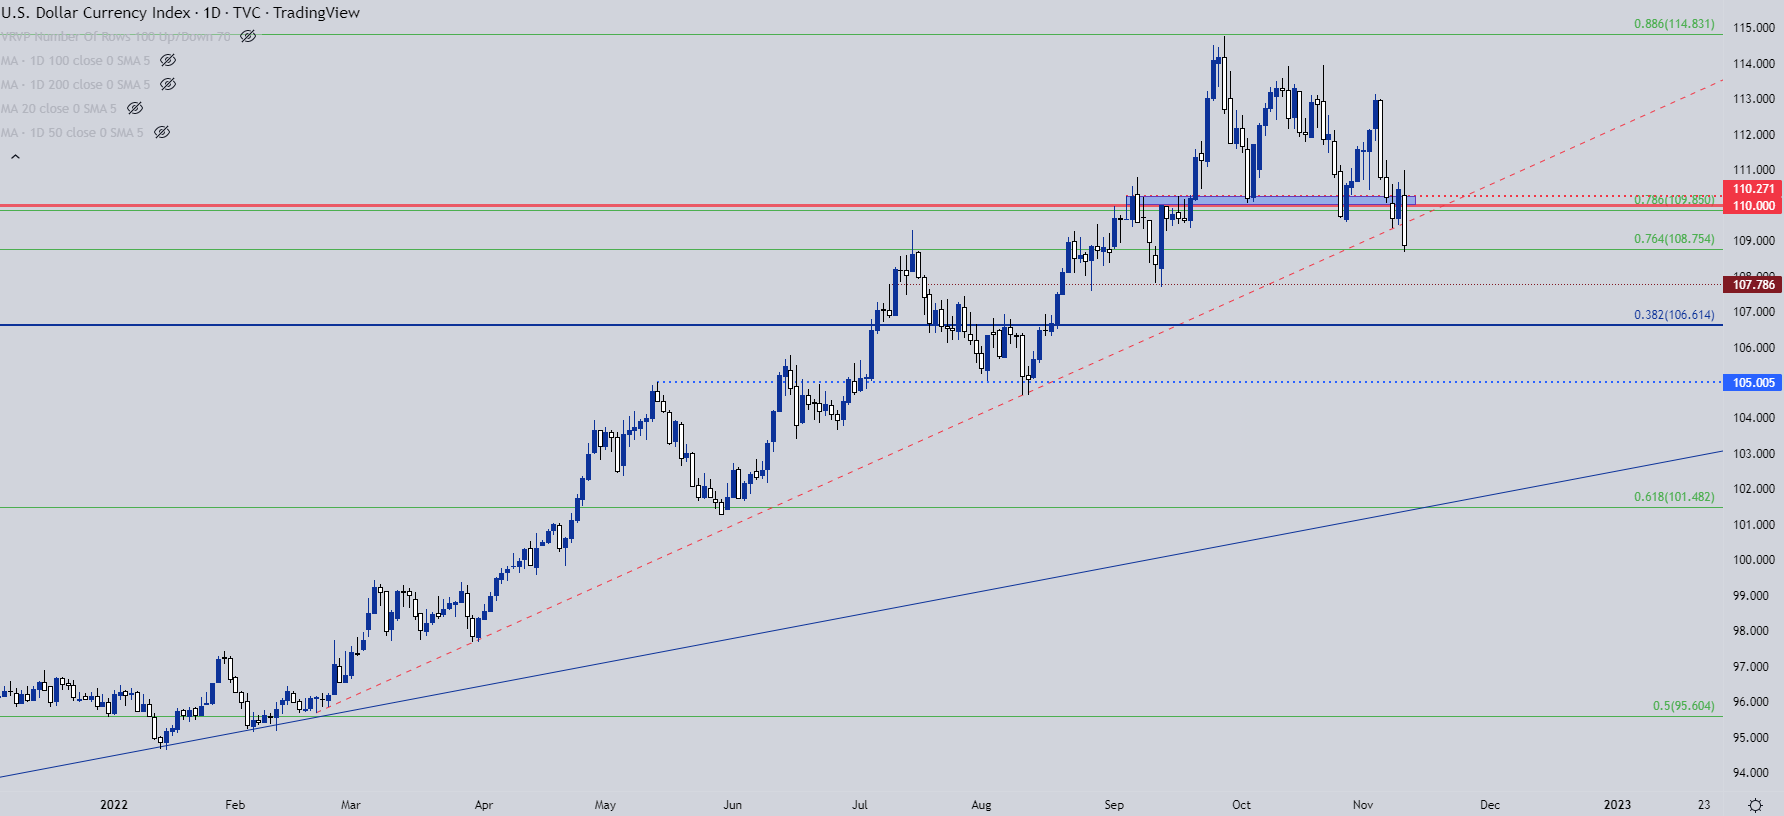
Chart prepared by James Stanley; USD, DXY on Tradingview
EUR/USD to Channel Resistance
I talked about this quite a bit yesterday but I even made the contention that EUR/USD performance may be even more important to DXY trajectory than even CPI.
This morning has brought a nice combination for EUR/USD bulls, as both the CPI print out of the US and comments from ECB members of more rate hikes on the way and hiking rates into ‘restrictive territory’ have pushed fundamental drive on the long side of the pair.
I looked into the price action structure yesterday, showing a pretty interesting setup in EUR/USD that could possibly turn into a double top formation, but would need a break through .9750 to make that an active formation. Instead, there was support potential at points of prior resistance, from 1.0000 to .9950 and down to .9900. And, the formation has now been invalidated with a bullish breakout to fresh highs.
Parity held the lows yesterday but sellers breached down to .9950 this morning ahead of CPI. That’s led into a strong move and EUR/USD has now pushed up to channel resistance.
EUR/USD Four-Hour Price Chart
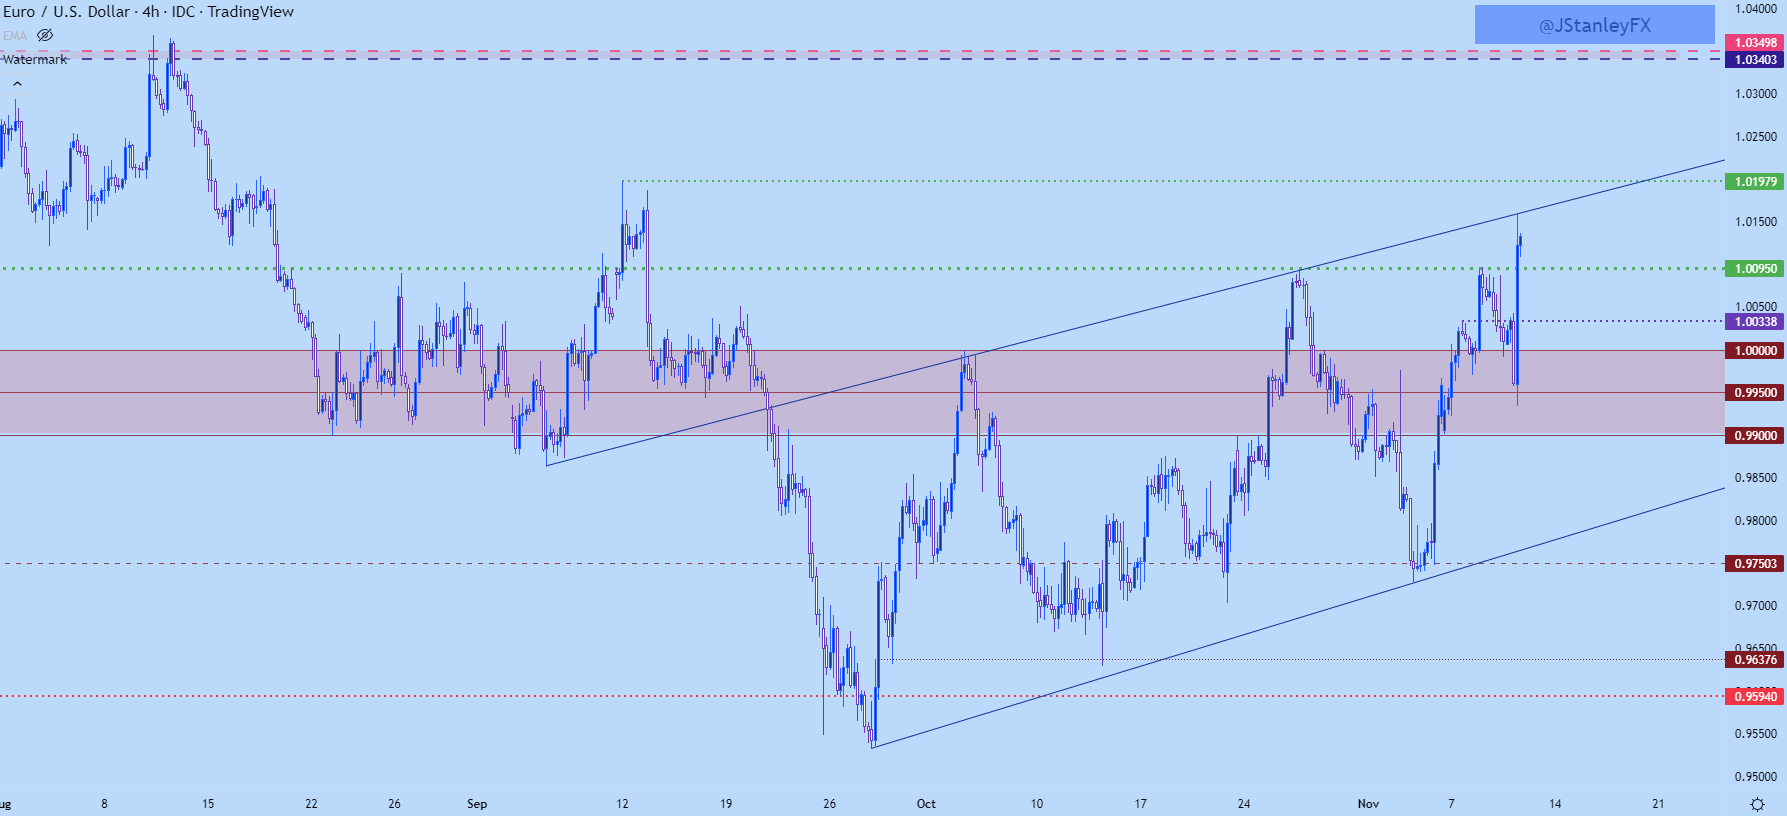
Chart prepared by James Stanley; EURUSD on Tradingview
EUR/USD Longer-Term
It’s been a struggle but EUR/USD has slowly re-claimed ground back above the parity handle and this can keep the door open for more bullish movement.
At this point, however, price remains in the bear flag formation with channel resistance coming in to hold the highs. But, notably, a continued breakout and a breach of the upper trendline can invalidate the formation, and this is something that can happen around longer-term reversals.
After all, many bullish trends begin as short squeezes and a bear flag formation can be a transitory state between the two, with invalidation of the flag serving as some form of confirmation of longer-term reversal potential.
With that said, price has already put in a massive move today. And support potential now exists at prior points of resistance, like 1.0095 or 1.0034 or even parity. As long as the low remains above this morning’s, the door for bullish continuation can remain open.
On the topside of price action, the next point of resistance on my chart is the current three-month-high at 1.0198, after which the 1.0350 zone comes back into the picture and that’s a big one on longer-term charts.

EUR/USD Daily Price Chart
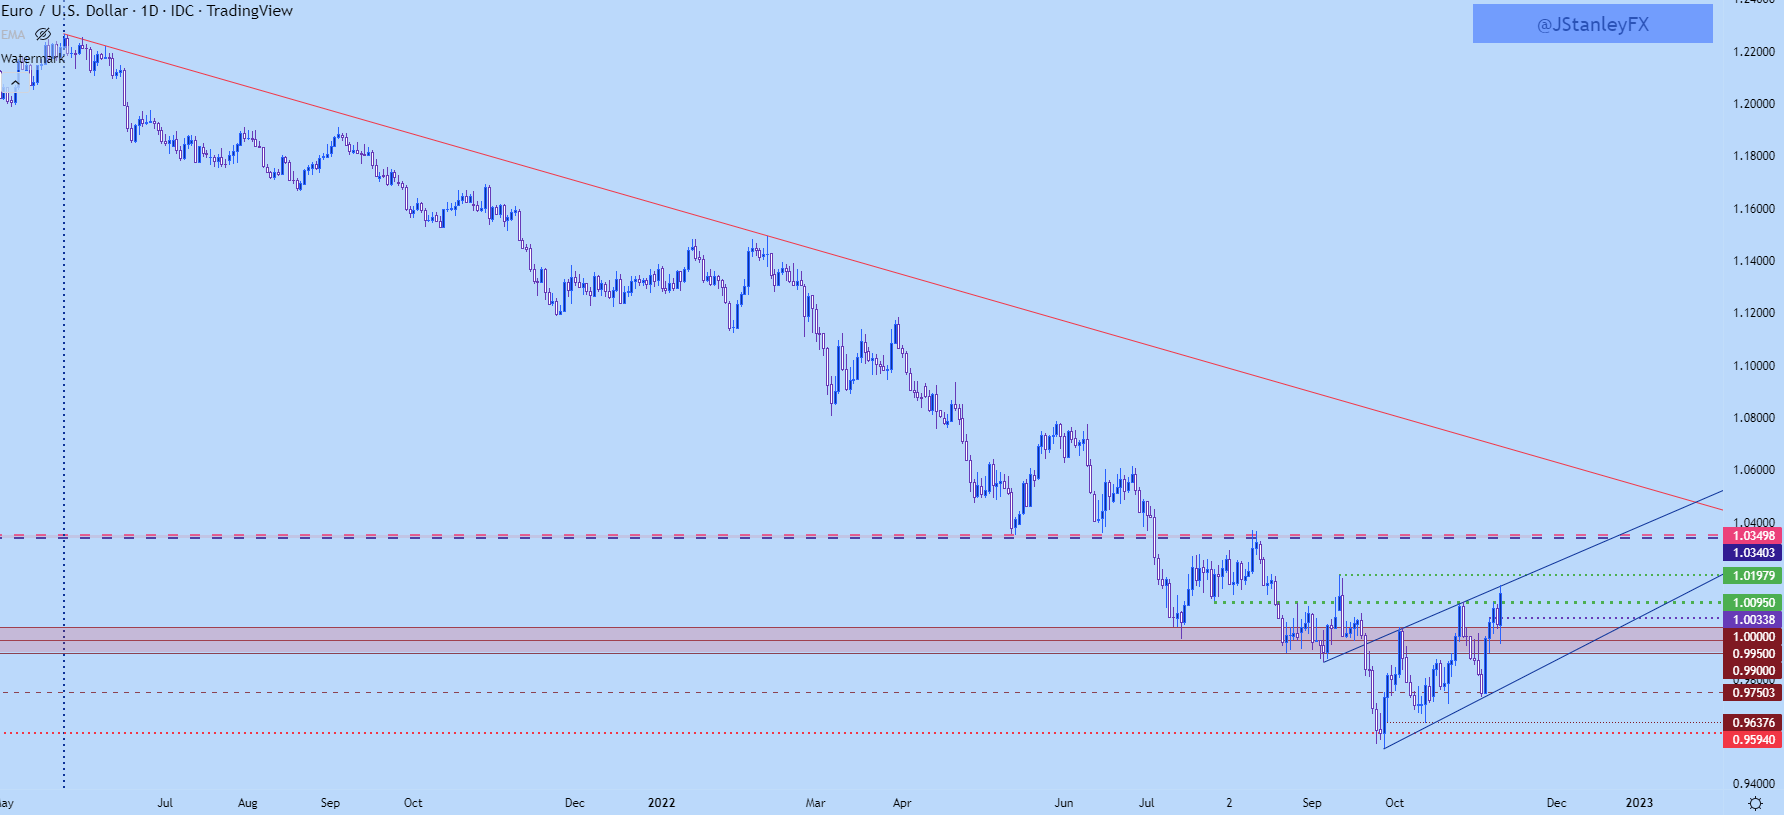
Chart prepared by James Stanley; EURUSD on Tradingview
Gold Breakout
A couple weeks ago, I highlighted another failed breakout in Gold prices, which has been a thing for bears so far this year. There’s been a number of false downside breakouts even amidst a strong bearish trend, and that’s made for a challenging backdrop for breakout strategies in the yellow metal
Last week saw a strong reaction to that support, with price pushing right up to a confluent spot of resistance. This was built from both a bearish trendline and a Fibonacci level, plotted around the 1680 level. Tuesday led to a breakout from that resistance and this morning is bringing yet another breakout, as price has pushed through the next resistance on the chart at 1737-1740.
Gold Daily Price Chart
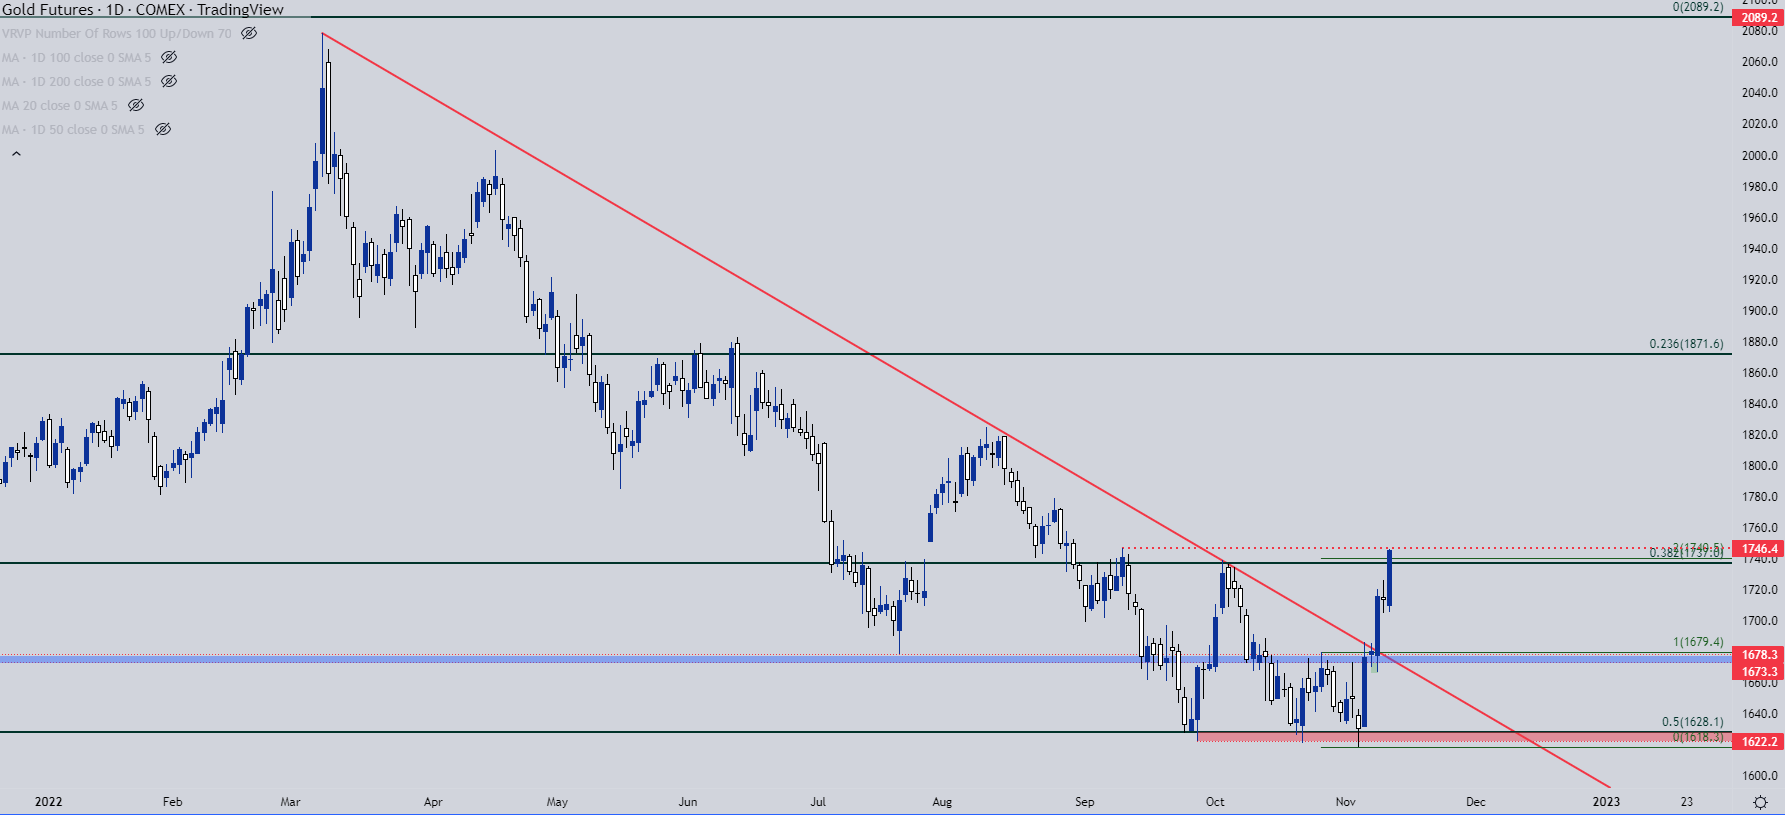
Chart prepared by James Stanley; Gold on Tradingview
Gold Shorter-Term
At this point, support potential exists at prior short-term resistance, taken from around 1720 and then around 1705. If the latter level can’t hold, then prior resistance around 1680 comes back into the picture and that’s around the time that bullish failure can be investigated. But, at this point, it’s a strong and decisive series of higher-highs and higher-lows on the four-hour chart.

Gold Four-Hour Price Chart
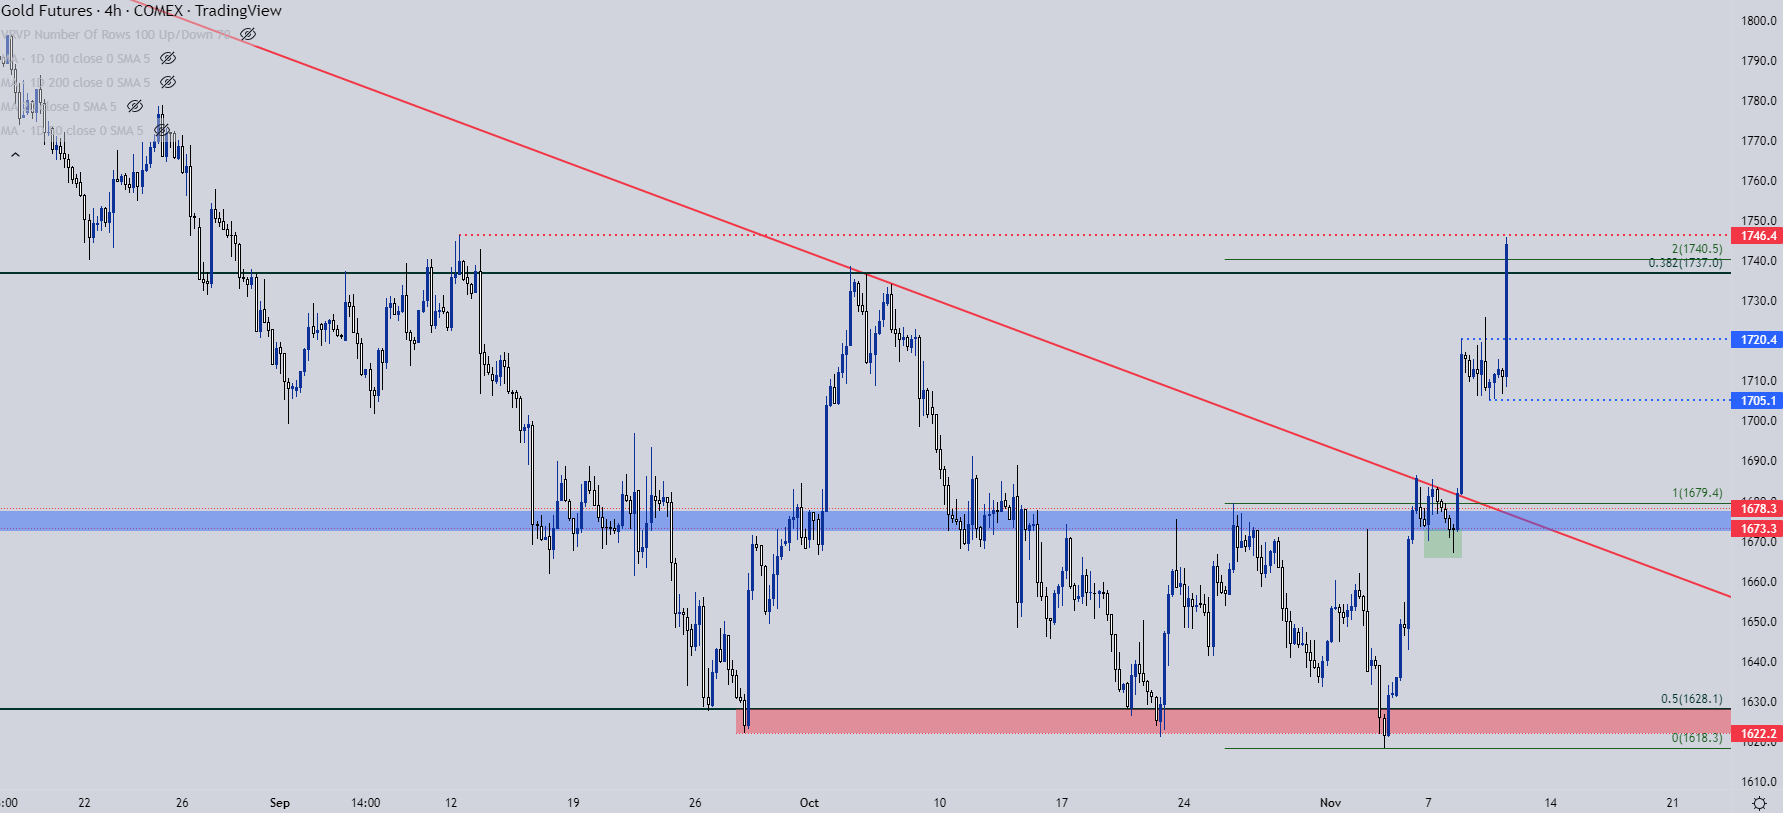
Chart prepared by James Stanley; Gold on Tradingview
--- Written by James Stanley, Senior Strategist, DailyFX.com & Head of DailyFX Education
Contact and follow James on Twitter: @JStanleyFX


