


Indices Technical Forecast: Neutral
- It was a preparation type of week for US equities as last week’s economic docket was relatively light compared to what’s in store for the week ahead.
- Next week brings CPI data on Tuesday and the Fed on Wednesday, with heavy expectation for 50 basis point hike. The bigger question and much more up for debate is how many rate hikes will be seen in 2023, placing emphasis on the Summary of Economic Projections (SEP).
- The S&P sold off on Monday and Tuesday but soon ran into a key zone of support that held the lows into the end of the week. The Nasdaq retains a more bearish appeal while the Dow has shown more bullish price action than what’s shown in the S&P 500.
- The analysis contained in article relies on price action and chart formations. To learn more about price action or chart patterns, check out our DailyFX Education section.

It was a relatively calm week on the economic calendar with the concentration of risk for US markets on Friday morning. And a strong PPI print on top of a Consumer Sentiment beat highlights continued strength in the US economy even as the Fed’s taken a historic route towards tightening policy throughout this year.
From a fundamental perspective, bearish potential remains, and the Fed has been pretty clear about their view for some time. With inflation remaining well-above target, the FOMC has little choice but to continue tightening policy, or at the very least holding on to those higher rates until inflation begins to moderate. And while we may have seen the initial stages of that moderation (still very early) the bank will probably need to keep rates elevated until inflation recedes closer to their target, even if not hiking at the pace of the past year.
The rubber meets the road at some point in 2023. Next week’s rate decision is highly-expected to be a 50 bp hike. Next year is considerably more wide open, with some expectations even looking for rate cuts to come into the picture while others are looking for rates to move up to as high as 5.5% from a current 3.75-4% range. And of course, just as we saw last December, those expectations can shift quickly, so the Fed’s opinion here is likely going to be very important as the last SEP was delivered in September, just before the USD had set its current 20-year-high.
Since then, we’ve heard a softening in Fed-speakers verbiage along with fear of repercussions from what the already outsized shift in hikes may bring next year. Below, I look into each of the three major US equity indices.
S&P 500
The year of 2022 has so far been one giant falling wedge formation. The S&P 500 set its current all-time-high in the first week of the New Year and bears soon started to take control of the matter.
S&P 500 Weekly Price Chart

Chart prepared by James Stanley; S&P 500 on Tradingview
Bears have had their run in the S&P 500 this year, with prices currently down about 17% from that January high. At one point the index was down by as much as 27% when this year’s low was set in October. The bigger issue here has been sentiment-related as there’s been a penchant for retail traders to get aggressively bearish at or near lows, which has led to a series of squeeze scenarios. And we may still be in the midst of one of those themes right now.
The current rally is almost two months old and has run as high as 17.36% up to the recent high. That high ran into resistance from a trendline that’s been in-place throughout this year, helping to set the high in August just before sellers reclaimed control of the matter into those October lows.
The trendline inflection last week gave an open door to sellers – but they were stymied at the same spot of support that’s been in-play for the past month, spanning from 3915-3928. I wrote about this on Tuesday and it held on Wednesday and led to a bounce on Thursday that extended through Friday.

S&P Daily Chart
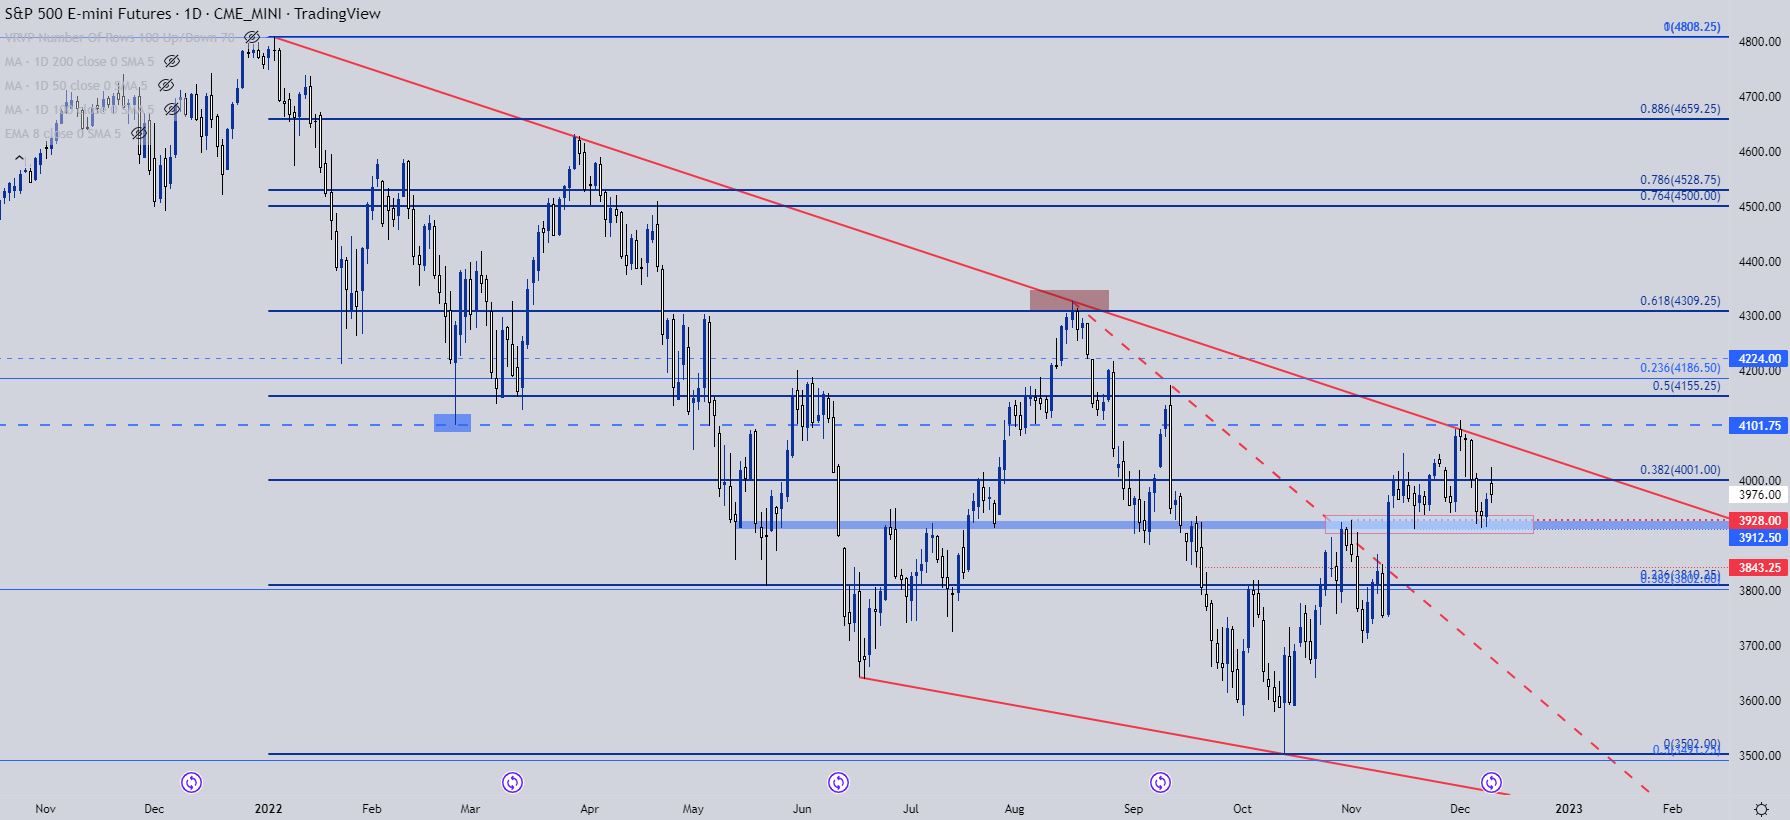
Chart prepared by James Stanley; S&P 500 on Tradingview
S&P Scenarios
After next week’s rather busy economic calendar, there’s but a couple of weeks left into the end of the year. And given that outsized sell-off that took place in the first nine and a half months of 2022, there’s likely still some shorts out there that may look to cover ahead of the end of the year, particularly if next week’s FOMC rate decision does not elicit a bearish response. And if we get a breach above the trendline, those shorts might feel the squeeze a bit more intensely.
This can open the door for a run above the 4100 level, perhaps even breaking above the longer-term falling wedge, and setting the stage for bearish scenarios after the 2023 open. There could even be scope for a run up to the 4186-4224 resistance zone, as a breach above the trendline will likely squeeze longer-term shorts.
The big question there is likely just how heavy handed Jerome Powell is during the press conference next week. We’ve seen two versions of Powell this year, mostly the balanced version that’s offered both hawkish and dovish verbiage, similar to his speech the week before last. But, there’s also been the more concise version that showed up at the Jackson Hole Economic Symposium in August, in which he directly tells markets that the Fed is going to continue to hike until inflation is under control.
If bears can take-out that 3915 support, the door can quickly open for a re-test of the Fibonacci levels just above the 3800 handle. But, if price can breach the 2022 trendline again as shorts get squeezed, there could be motive for a continued bullish move into the end of the year.
S&P 500 Daily Chart
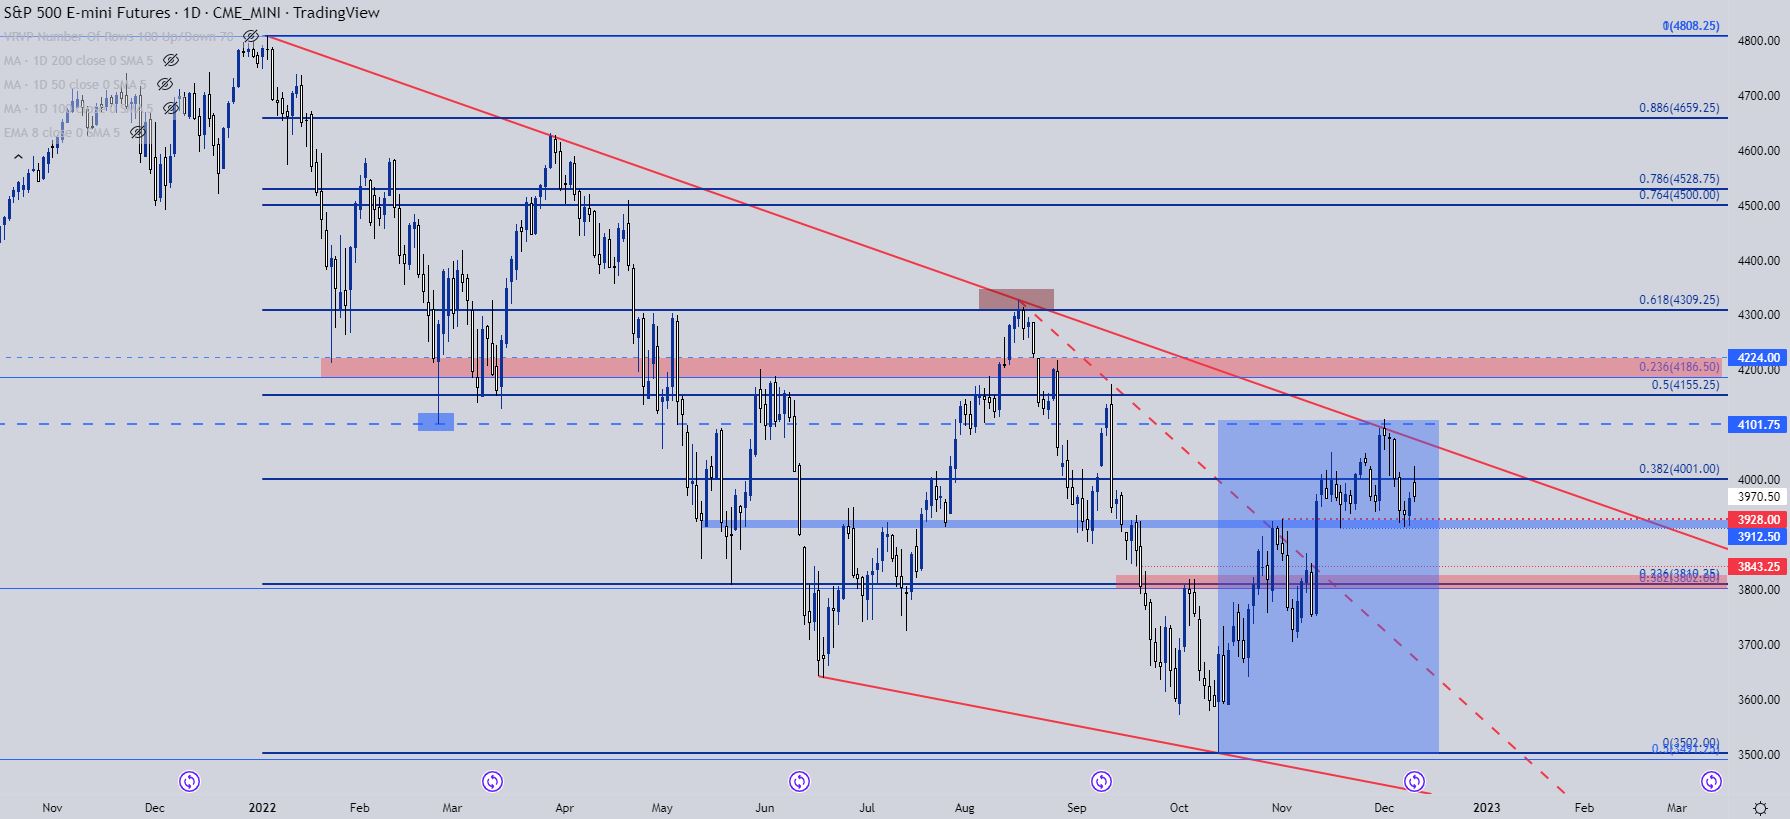
Chart prepared by James Stanley; S&P 500 on Tradingview
Nasdaq
If looking at bearish stances on US equities, the Nasdaq may hold more attraction. It was the hardest hit on the way down, falling by as much as 36.7% from the January high against the S&P’s 27% sell-off. It’s also been a bit slower to recover, with a maximum move of 15.36% from the October low against the S&P’s +17% move over the same stretch.
Support in October showed up at a key spot, between two longer-term Fibonacci levels spanning between 10,501 and 10,751. The bottom of the zone helped to set the October low while the top of the zone helped to set the November swing-low.

Nasdaq Weekly Chart

Chart prepared by James Stanley; Nasdaq 100 on Tradingview
More recently, as the S&P spiked up to a fresh high two weeks ago, the Nasdaq remained more subdued, holding resistance around the same swing-high that was in-play a couple of weeks prior. This sets up a possible double top formation, which could open the door for bears if support can give way next week.
On a shorter-term basis, sellers tested support last Wednesday but weren’t able to hold a break. That led to a bounce on Thursday followed by the gapped-open on Friday and, at this point, price is near the mid-point of the recent range. This is a tough spot on the chart to establish exposure, in either direction; but if bulls can force a breach above 12,140 which is confluent with the bearish trendline next week, that door for bullish scenarios could re-open.
But, if bears are able to elicit a breach of the support zone around 11,470, there could be another test of the longer-term support zone as the 700 points of distance between the top and the ‘neckline’ of the formation could project to a test of 700 points below that level, which would show around 10,770.
Nasdaq Daily Price Chart

Chart prepared by James Stanley; Nasdaq 100 on Tradingview
Dow
The Dow is currently up by more than 18% from the low on October 3rd. Notably, the S&P and Nasdaq both set their low on October 13th but for the Dow, that bearish run led to a higher-low and as prices ramped, the Dow led the way with a move as large as 21.2% to the high set two weeks ago. And while the S&P tangles with the 2022 bearish trendline and the Nasdaq sits below its own version of the same trendline, the Dow has already scaled above that level on the way to higher-highs. The Dow is also the only index amongst the three discussed in this article that’s trading above the 200 day moving average.
Last week saw pullback on Monday and Tuesday, but support showed at a spot of prior resistance before prices gained on Thursday and Friday. Thursday completed a morning star formation, often approached with the aim of bullish reversals; and for traders that are looking at bullish US equity stances into the end of the year, the Dow could certainly remain as an attractive option.

Dow Jones Daily Price Chart
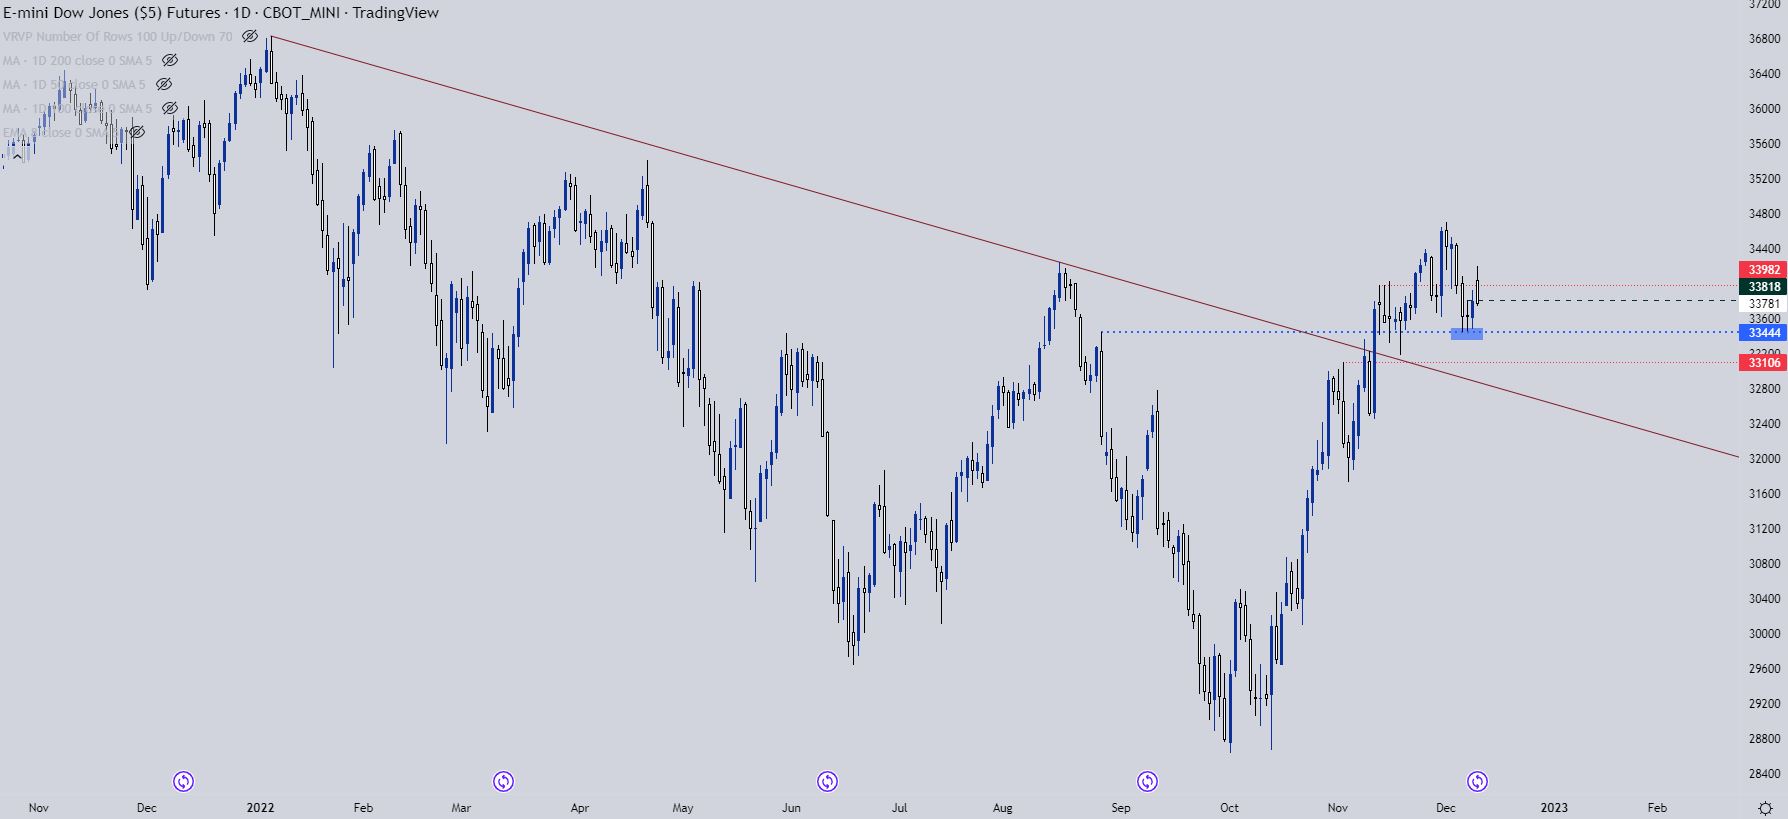
Chart prepared by James Stanley; Dow Jones on Tradingview
--- Written by James Stanley, Senior Strategist, DailyFX.com & Head of DailyFX Education
Contact and follow James on Twitter: @JStanleyFX


