


Stocks, Treasuries, USD Talking Points:
- This is an archived webinar from Sept. 27th, less than a week after the September FOMC rate decision. To be notified of upcoming webinars, the link below the talking points can set that up.
- There’s a number of pressure points in markets at the moment and much of that is feeding from surging US yields, which increases pressure elsewhere in the financial system. We’ve already seen a collapse-like move in a major currency (GBP) with another hanging on to support by a thread (EURUSD). Stocks, at this point, look relatively calm. Something doesn’t add up and as I said in the early part of the webinar, one of these themes seems to be offsides.
- The analysis contained in article relies on price action and chart formations. To learn more about price action or chart patterns, check out our DailyFX Education section.
We’re not quite a week out from the September FOMC rate decision and still a number of themes remain unsettled. US rates are shooting through the roof in a parabolic fashion and this is helping to push USD-strength, as well. That USD strength has increased strain elsewhere, including in the U.K. where the British Pound put in a collapse-like move to start this week. Perhaps disturbingly for the rest of the world, the Euro isn’t looking too healthy, either, with EUR/USD grasping at support after putting in a decisive breach of the parity level last week, just after the Fed.
Stocks, meanwhile, are just starting to tip-toe below the prior low set in June. This, in my opinion, is due to the ‘buy the dip’ mentality that was so commonplace for much of the post-pandemic run, fueled by cheap rates and QE which are both on their way out. But, there’s still signs of that behavior and this is likely – or has likely – helped stocks to hold up a bit better than one might expect even as we’re seeing both FX and bond markets screaming panic. I’ve chosen my side and I remain bearish on stocks. It’s my Top Trade for Q4 as it was in Q2 and Q3 (bullish USD for Q1).

US Rates
The 10-Year is now approaching 4% which would be 60% higher than the 2.5% that was showing in early-August. This is one of the most important assets in the world and it’s trading like a meme stock or an alt-coin. The monthly chart is below.
US Ten Year Treasury Yields
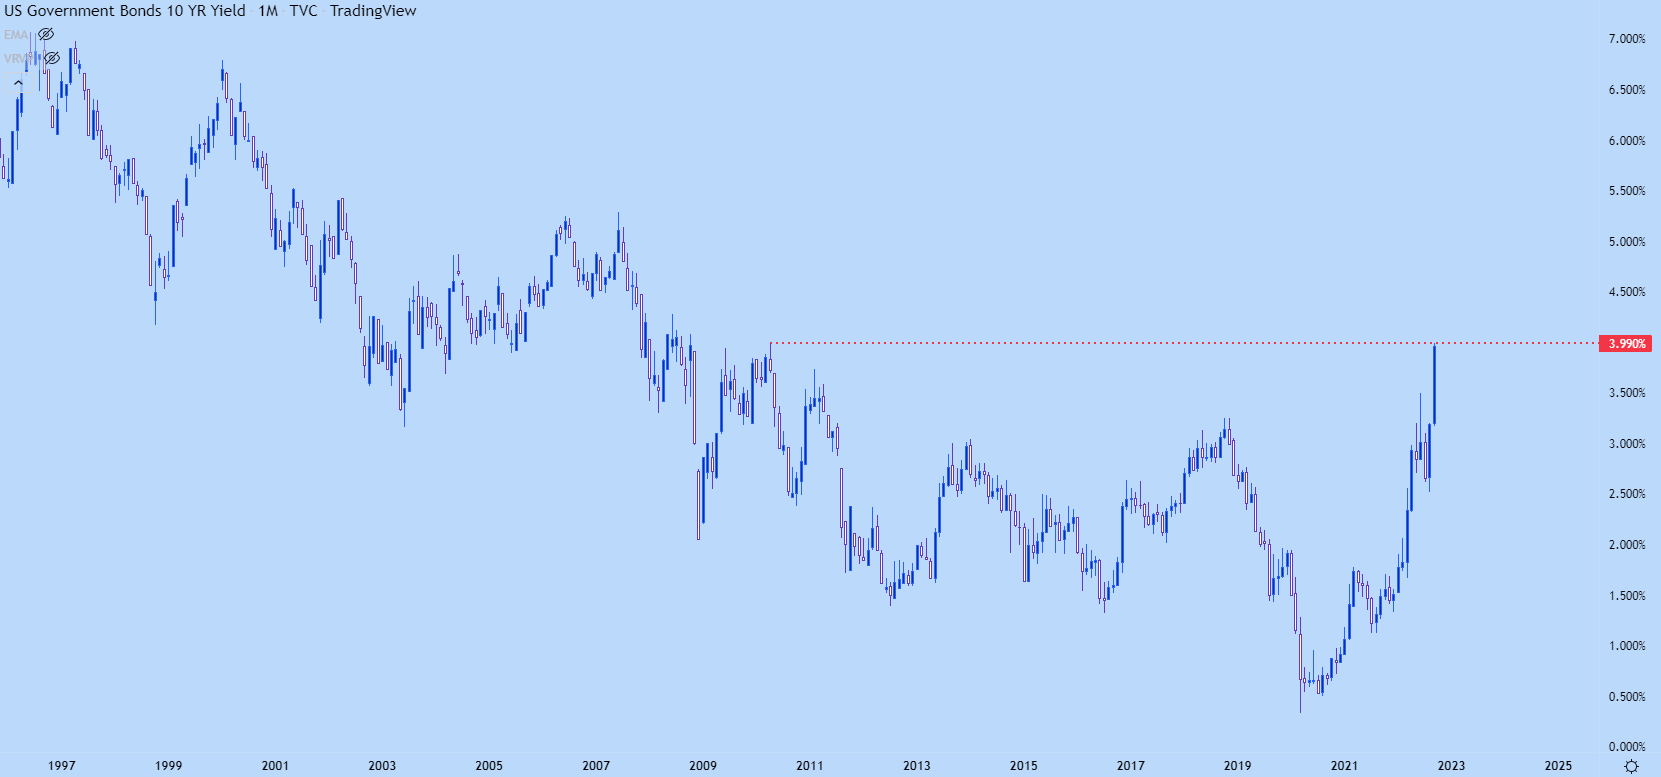
Chart prepared by James Stanley
The longer-end of the curve is getting into the action as well, with the 30 year now trading at a fresh eight-year high of 3.83%
The more impressive shift here, in my opinion, is the hastening of the recent trend after breaking a trend channel that was in-place for more than 30 years.
US 30 Year Treasury Yields
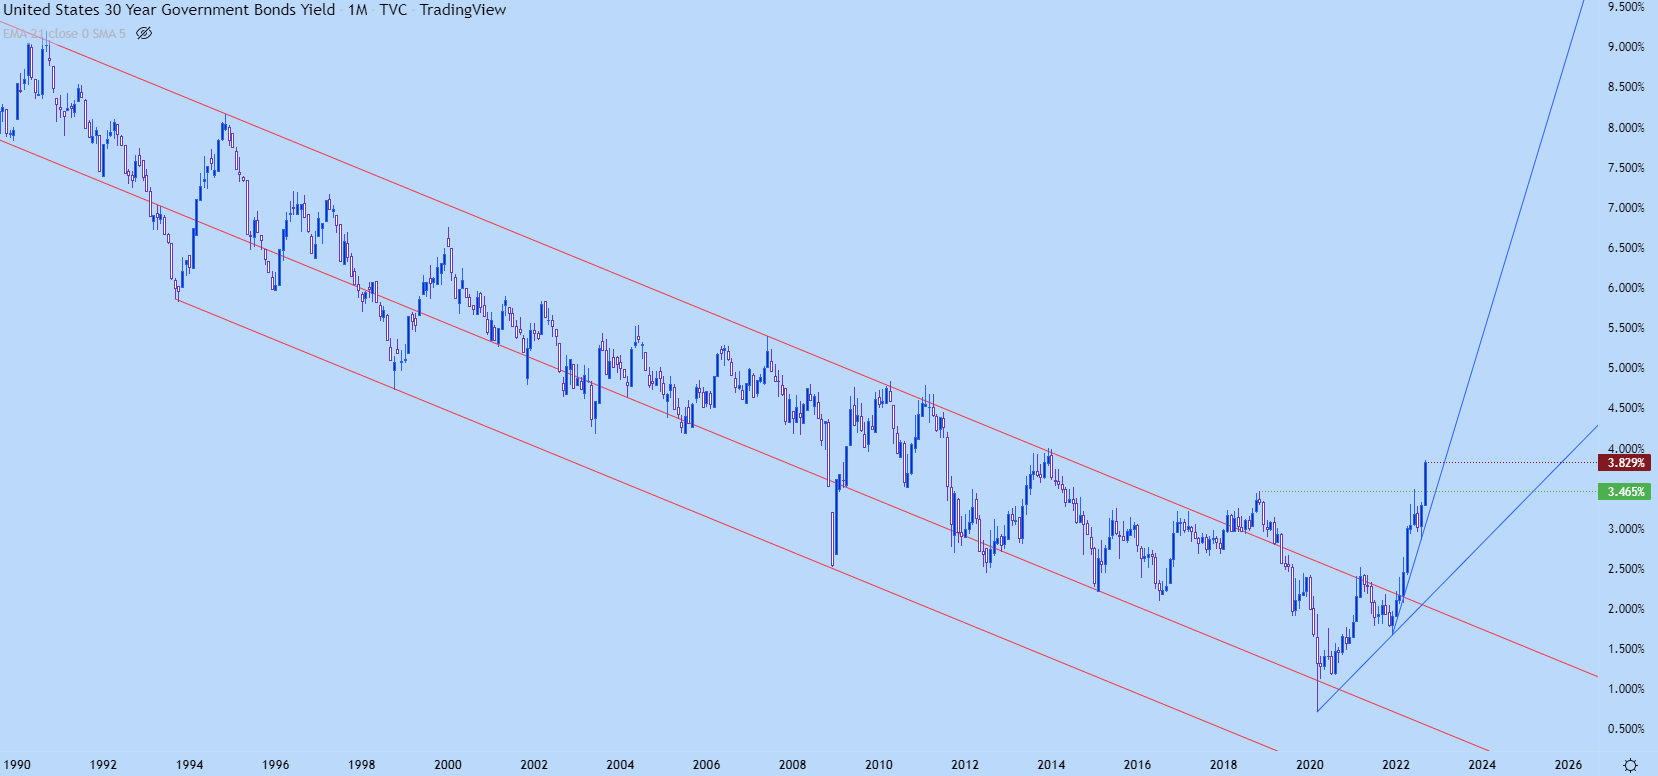
Chart prepared by James Stanley
Shorter-term US rates are often more correlated with the US Dollar and that end of the curve has been shooting higher for some time now.
Yesterday saw a fresh 15-year high in Two year treasury yields, at 4.36%.
US Two Year Rates
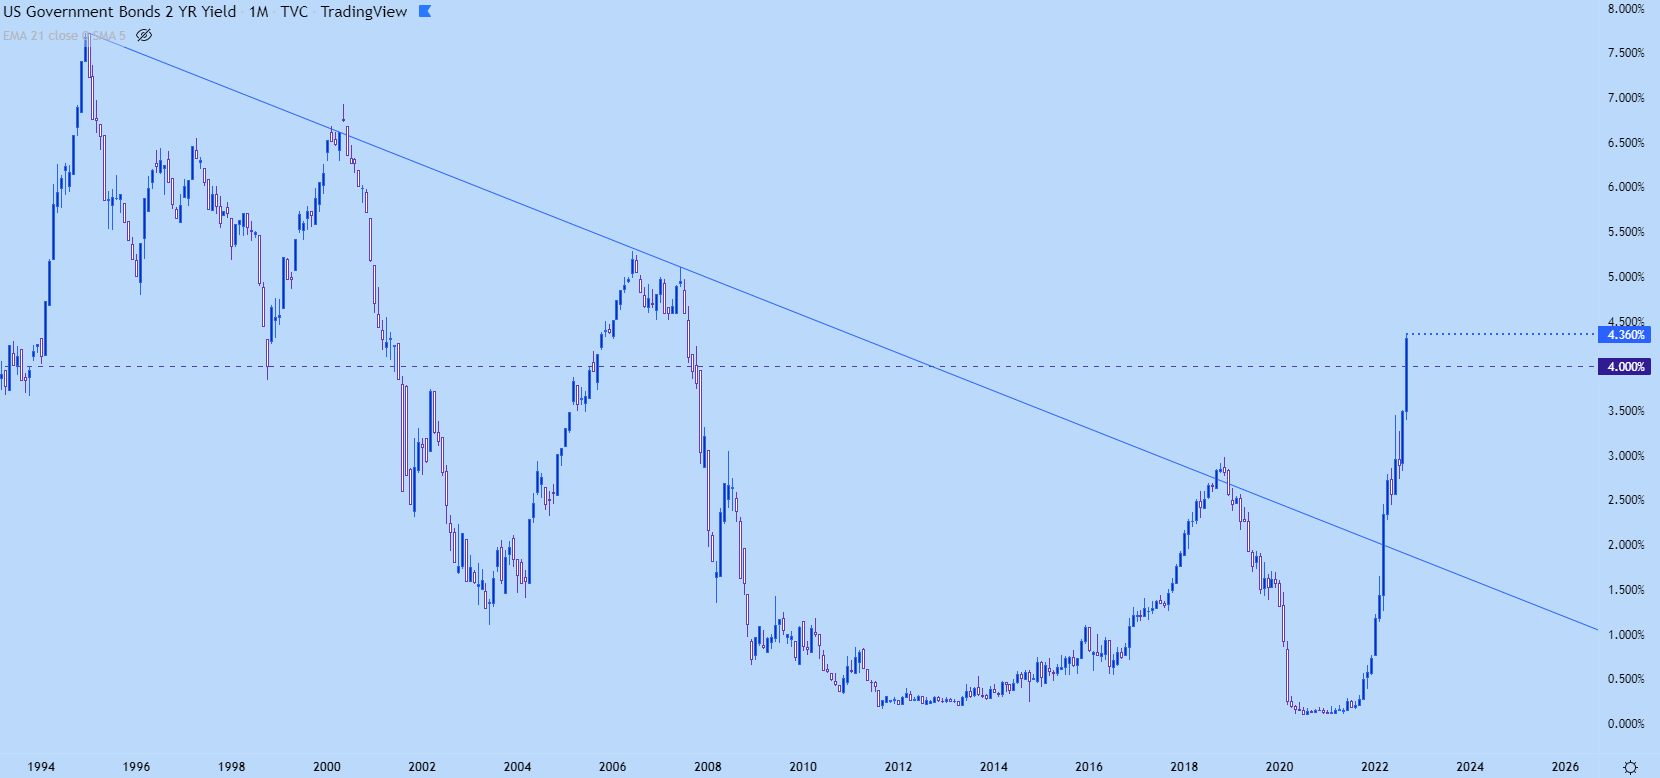
Chart prepared by James Stanley
The Problem with the Above
The Two year is trading at 4.36% yield while the 10 year nears 4%. And then the 30 year is all the way down at 3.83%.
This is curve inversion. And this is often a sign that investors are getting more and more bearish. Going into a bank and being offered a loan for 30 years at half a percent less than they would charge you for a loan term of two years – well that’s distortion, on a massive scale.
Curve inversion will often happen in Treasuries when market participants are bearish. So, rather than investing in stocks or parking in short-term Treasuries to grab the yield in a non-committal fashion, they can also look at onboarding longer-dated Treasuries which, in the event of eventual rate cuts, could see principal appreciation.
In essence, the longer-end of the curve can invert with yields going below the shorter-end as investors anticipate an eventual backdrop that would necessitate lower rates from the Fed.
Again, the big take away is massive distortion, and given the run in short-term yields, we can also see a jump in the US Dollar, which has been going on since June of last year. The US Dollar trend has continued to grow more and more strong, as indicated by the increasing angle of the trendlines on the below daily chart.
US Dollar Daily Chart
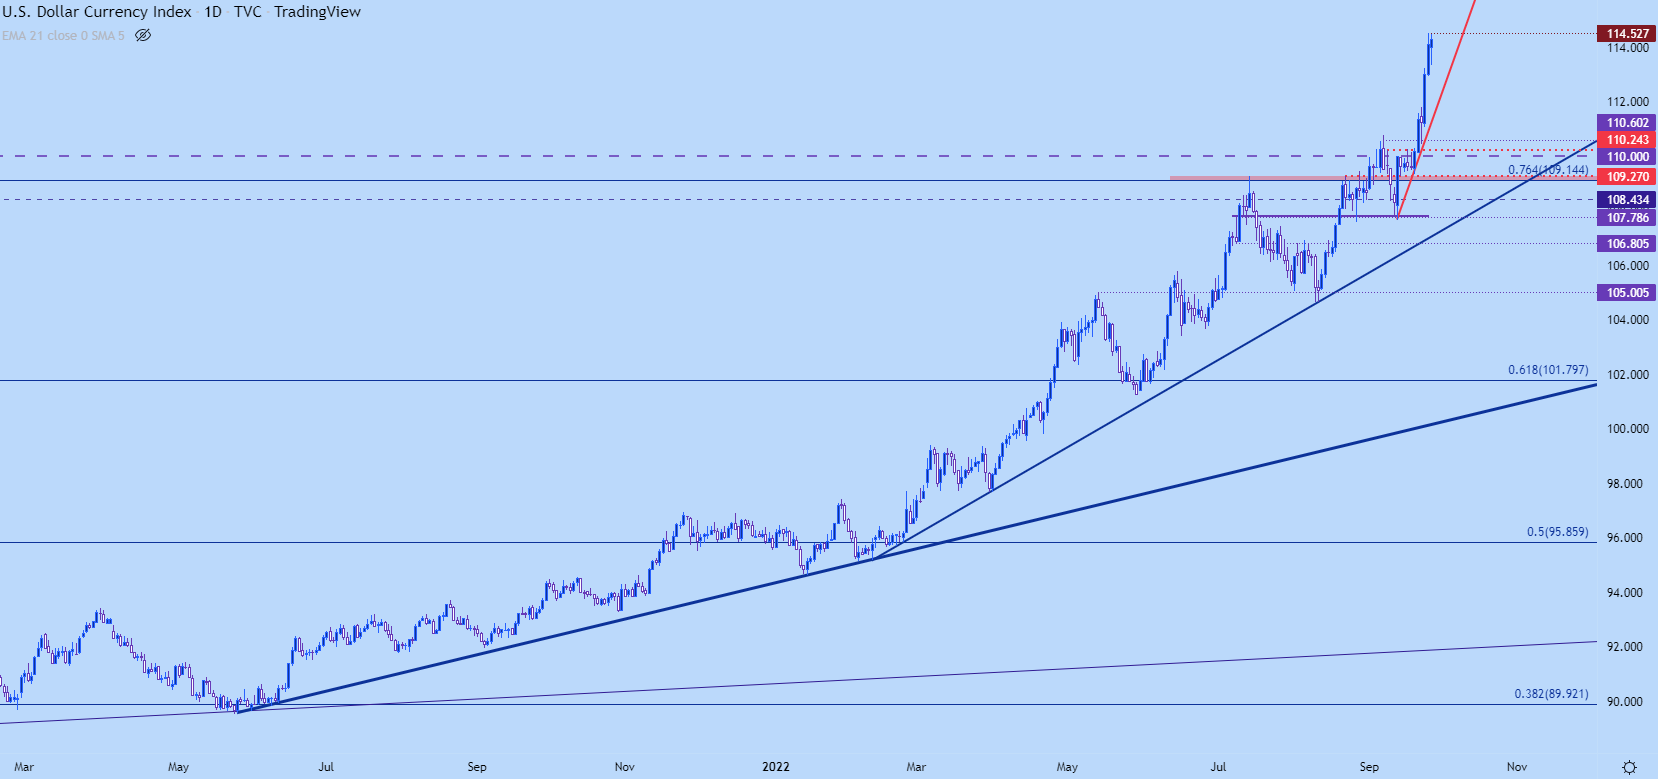
Chart prepared by James Stanley; USD, DXY on Tradingview
USD Forecast
The US Dollar is overbought from a number of vantage points. But that hasn’t really mattered of late, as the USD just keeps on pushing to fresh highs.
The disconcerting aspect of this is one of counterparts: The British Pound just collapsed and there hasn’t been a larger bullish response to that, helping to keep USD pegged near the highs. EUR/USD is hanging on to support by a thread and last week, made a convincing move below parity. And even the intervention efforts from Japan, via the BoJ/MoF have fallen flat with USD/JPY just jumping right back to 145.00.
All paths have led through the US Dollar and there’s no end in sight yet. This morning saw a bullish breach of the symmetrical triangle formation and price is already nearing a re-test of the high at 114.51.

US Dollar Hourly Chart
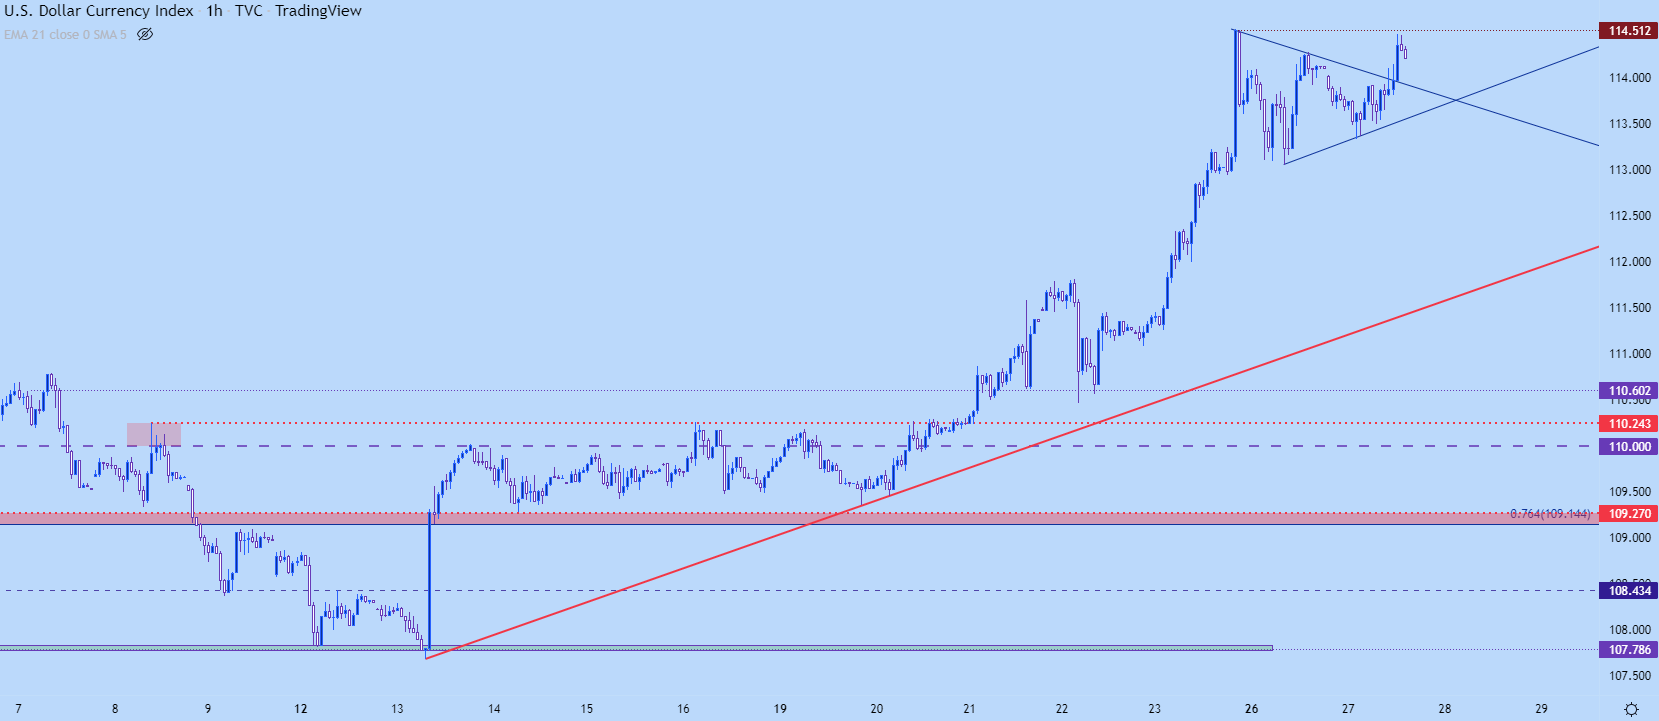
Chart prepared by James Stanley; USD, DXY on Tradingview
EUR/USD
This is the point of worry for me as the implications would be large. A steeper fall in the Euro means more inflationary pressure for Europe at a time when they can ill-afford it. And rate hikes from the ECB? They seem to have done little for the matter so far and the more the ECB talks, the more the market seems to fade them, instead favoring USD and higher US yields.
The parity level had some pull in EUR/USD until last weeks break, which led to a continuation move so far this week.
EUR/USD Monthly Chart
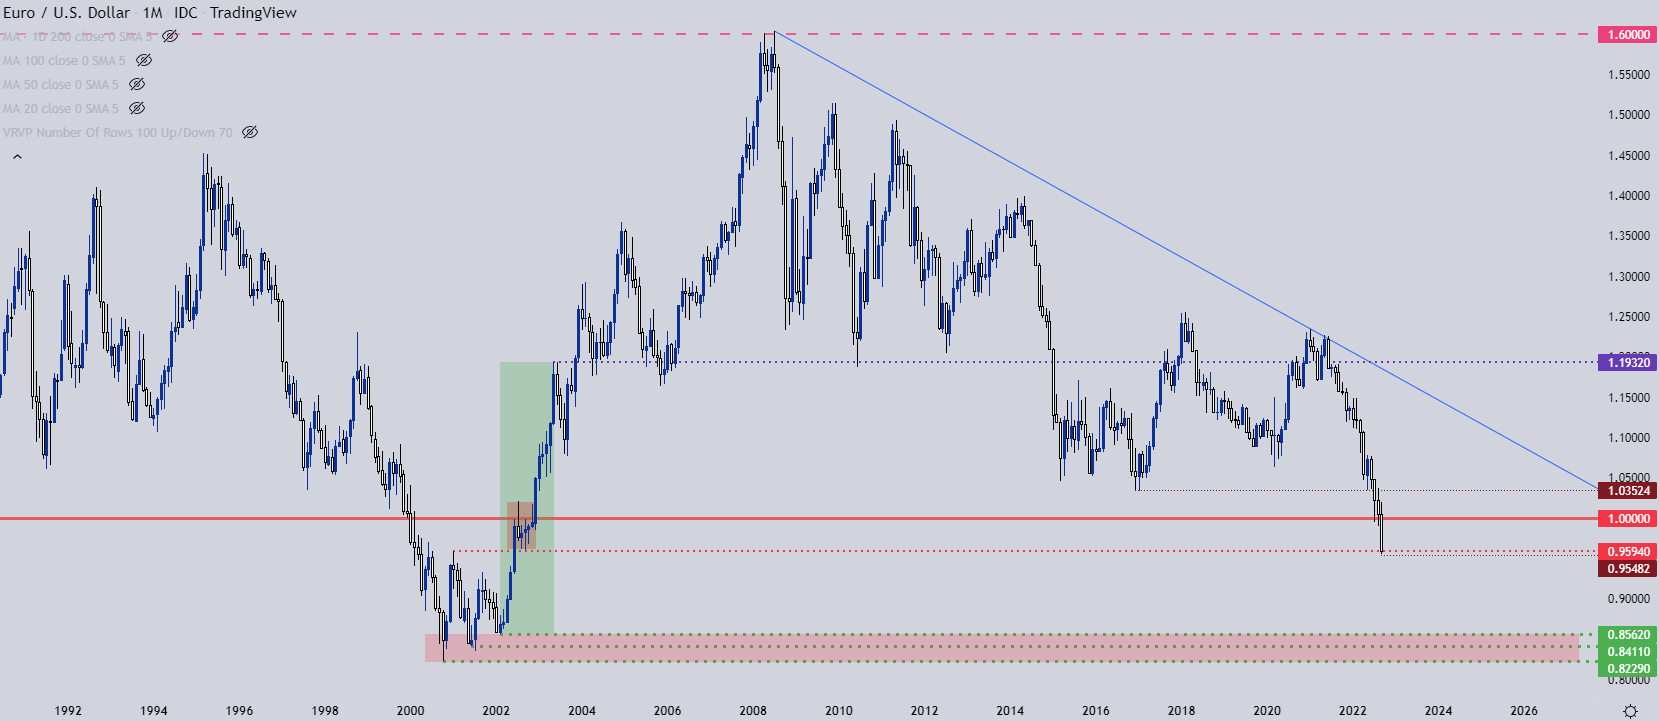
Chart prepared by James Stanley; EURUSD on Tradingview
Stocks
The S&P 500 set a fresh yearly low during the webinar, towards the end, and as of this writing I’m seeing a support response from the 3639 level that helped to set the June low.
And this somewhat illustrates my point, as the above items are all indicating panic. Meanwhile, stocks are still seeing some bullish activity on tests of support and the action remains very much two-sided, although there has been a bearish bias.
But, taking a step back, matters seem a bit more worrisome to me than they did in June and in stocks, prices are around the same levels, even with the Fed taking on a heavier and heavier hand.
S&P 500 Weekly Chart
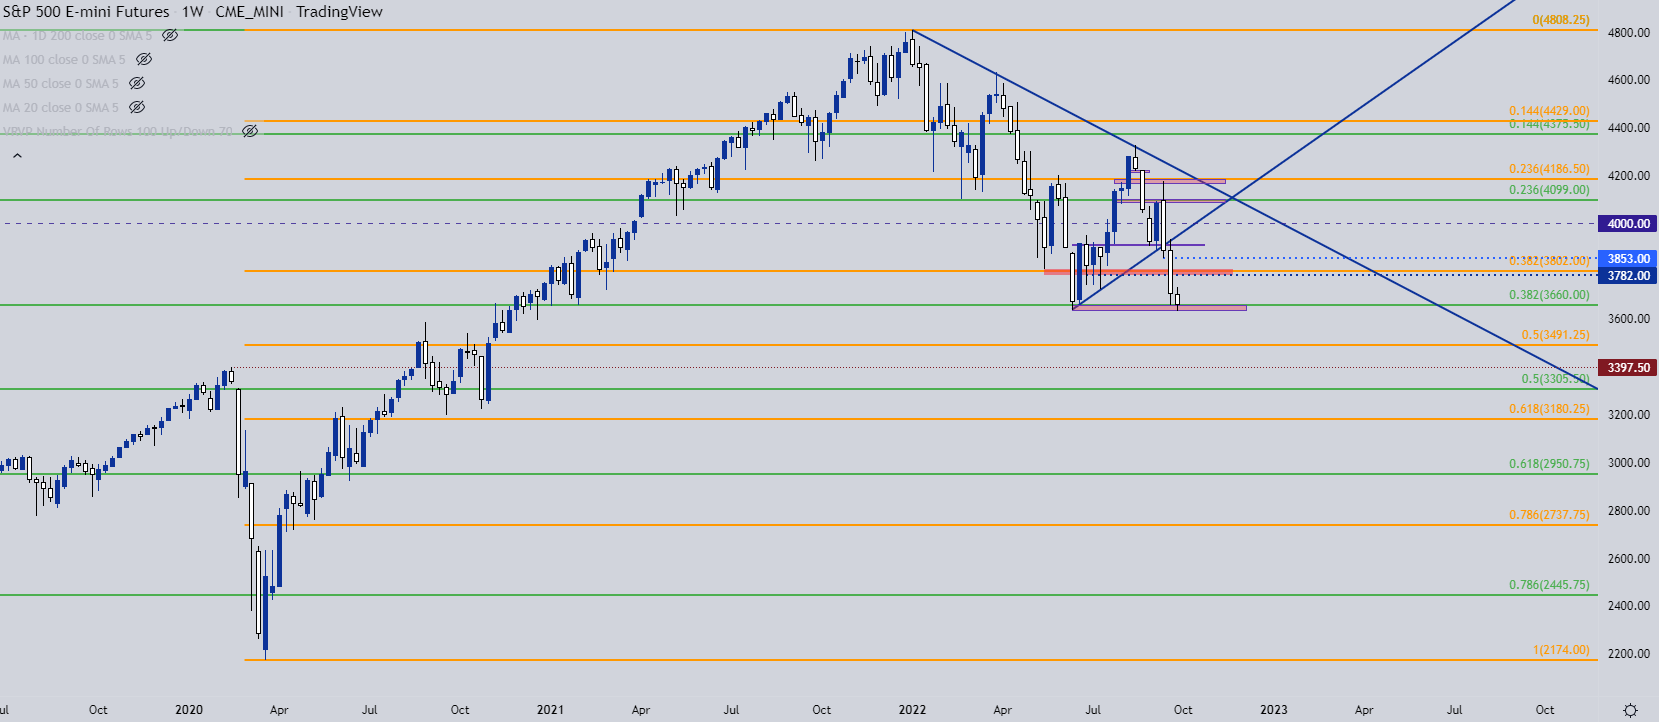
Chart prepared by James Stanley; S&P 500 on Tradingview
Nasdaq Support
The Nasdaq is similarly placed around prior June lows with the exception that it hasn’t yet pushed below that prior point, so technically the Nasdaq looks a bit healthier than the S&P 500, which seems strange given the circumstances of higher rates pushing risk aversion.
The yearly low is at 11,069 and below that, there’s support potential via Fibonacci retracements around 10,501 and then a big zone running from the pre-pandemic high of 9753 up to the Fibonacci level at 10002.

Nasdaq Weekly Chart
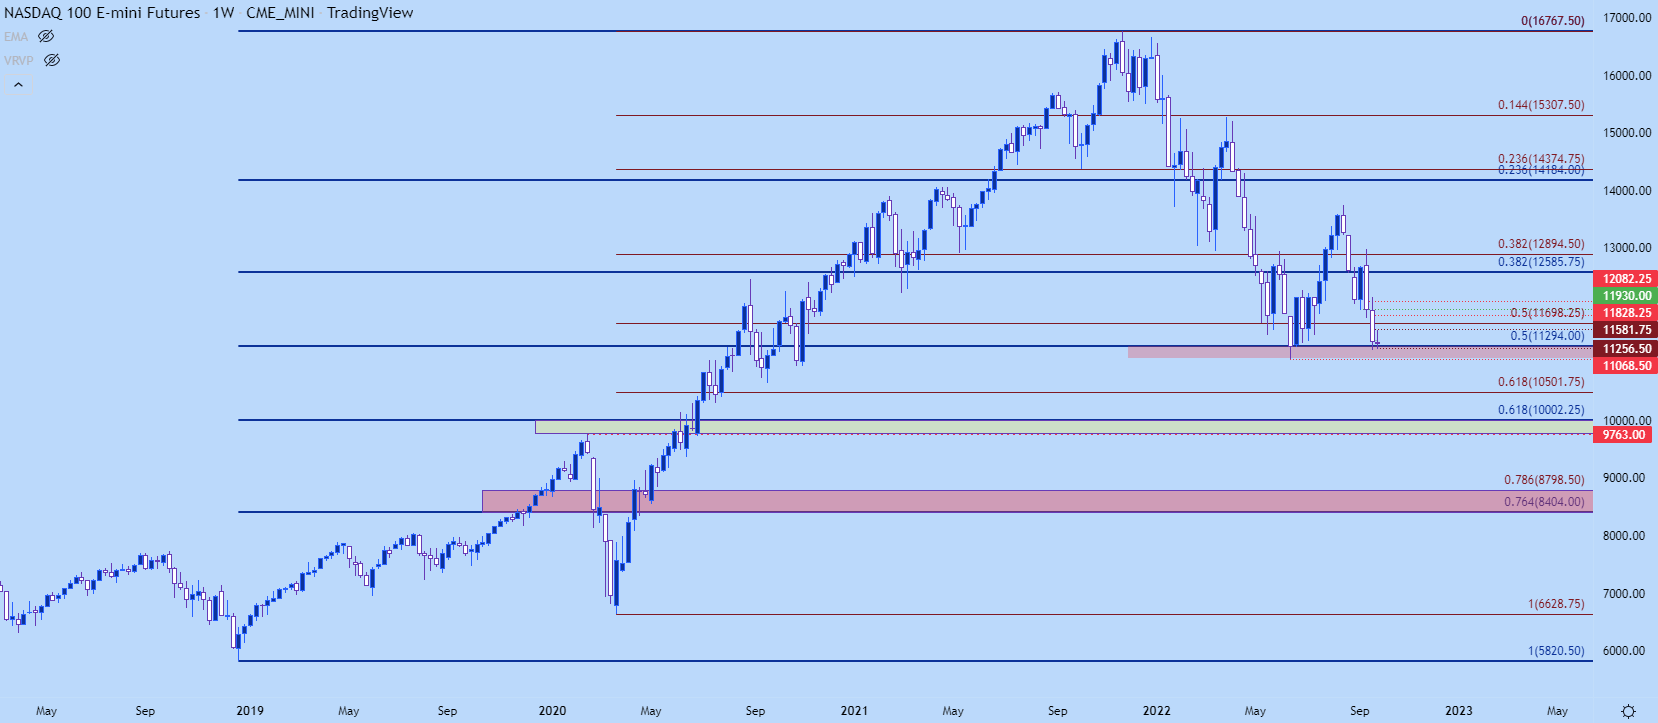
Chart prepared by James Stanley; Nasdaq 100 on Tradingview
--- Written by James Stanley, Senior Strategist, DailyFX.com & Head of DailyFX Education
Contact and follow James on Twitter: @JStanleyFX


