


STOCK MARKET WEEK AHEAD OUTLOOK: BEARISH TO NEUTRAL
- S&P 500 and Nasdaq 100 close the week higher despite rising Treasury yields
- The Fed’s hawkish monetary policy outlook remains a key risk for stocks
- Powell’s testimony before Congress and the February U.S. employment report will take the spotlight next week

Most Read: USD/JPY Retains Bullish Outlook, Fundamentals Undermine the Japanese Yen
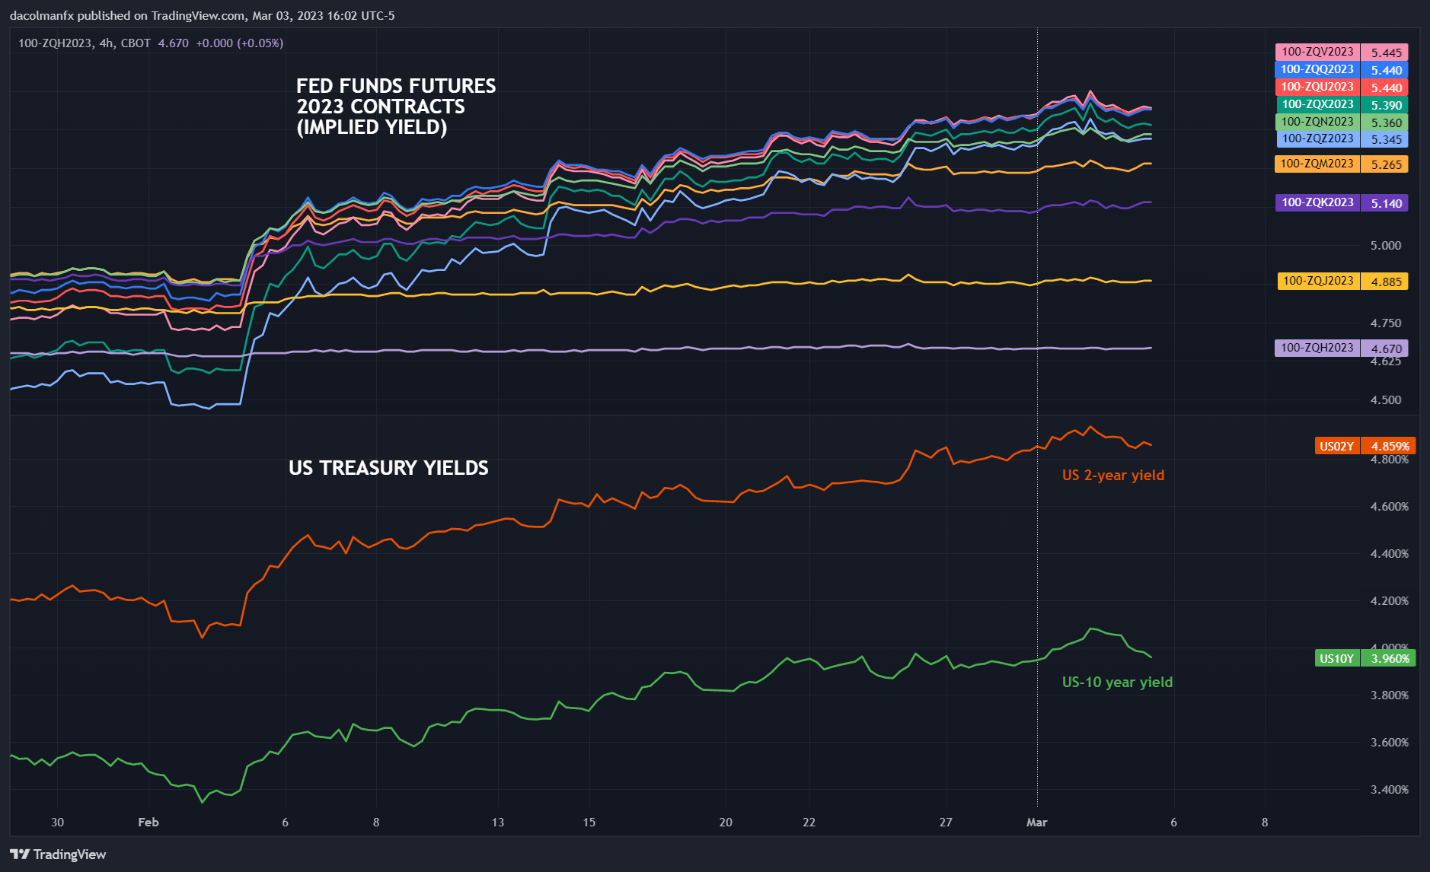
U.S. bond yields extended their recent rally this past week despite a moderate pullback on Friday, rising across most maturities amid a hawkish repricing of the Fed’s monetary policy outlook in the wake of hotter-than-expected economic data. At one point on Thursday, the entire Treasury curve topped 4.0% as expectations for the FOMC’s terminal rate drifted upwards and traders started to brace for a “higher-for-longer” interest rate regime in response to sticky inflation.
Counterintuitively, both the S&P 500 and Nasdaq 100 managed to close the week with solid gains, up about 1.9% and 2.6%, respectively, shrugging off volatility in the fixed income space and surprising investors who had anticipated more subdued performance due to Fed jitters.
However, the strength in equity markets could reverse early next week, ahead of the release of a key U.S. macro report on Friday, March 10: the February U.S. employment report. Fed chairman Powell’s semi-annual testimony before Congress could also rattle positive sentiment if he embraces a forceful tone following the latest string of strong macro numbers.
2023 FED FUNDS FUTURES & US TREASURY YIELDS CHART
Traders may be tempted to start trimming exposure to risk assets and stay on the sidelines in the coming days to avoid stepping into “hawkish rhetoric” or, more importantly, a "hawkish datapoint" that could provide confirmation that the U.S. economy is holding up remarkably well and will likely require additional monetary tightening. This scenario could lead to some selling on Wall Street, biasing both the S&P 500 and Nasdaq 100 to the downside in the very near term.
Focusing on the incoming nonfarm payrolls survey (NFP), U.S. employers are forecast to have added 200,000 workers last month, after hiring a whopping 517,000 people in January. Nevertheless, persistently low jobless claims in recent weeks, coupled with a sturdy rebound in the ISM services’ employment index, suggest labor market data could handily exceed consensus estimates.
US EMPLOYMENT REPORT EXPECTATIONS
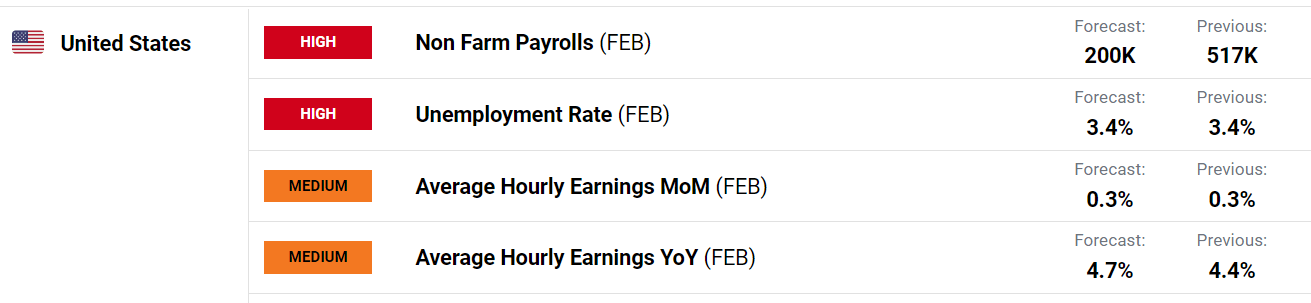
Source: DailyFX Economic Calendar
Another hot NFP report will raise the risks that the Fed will ultimately do more to slow the economy to prevent elevated wage growth and demand pressures from exacerbating inflationary forces, which are showing tentative signs of regaining momentum. This means policymakers could start frontloading hikes again, while simultaneously signaling a higher peak rate of around 6.0%. Obviously, this would be a negative outcome for the stock market capable of undermining equities in the near term.
| Change in | Longs | Shorts | OI |
| Daily | 1% | -1% | 0% |
| Weekly | 15% | -13% | -1% |
NASDAQ 100 TECHNICAL ANALYSIS
After finding technical support and rebounding off its 200-day simple moving average, the Nasdaq 100 has charged higher, with bulls now eyeing short-term trendline resistance near 12,400. If traders manage to push the tech index above this barrier in the coming sessions, buying interest could pick momentum, paving the way for a move towards 12,675, followed by 12,870, the 38.2% Fibonacci retracement of the November 2021/October 2022 slump. On the flip side, if sellers regain decisive control of the market and trigger a bearish reversal, initial support appears at 11,900/11,820. If this area is taken out, bears could launch an attack on 11,655, the 50% Fib retracement of the October 2022/February 2023 rally.
NASDAQ 100 TECHNICAL CHART
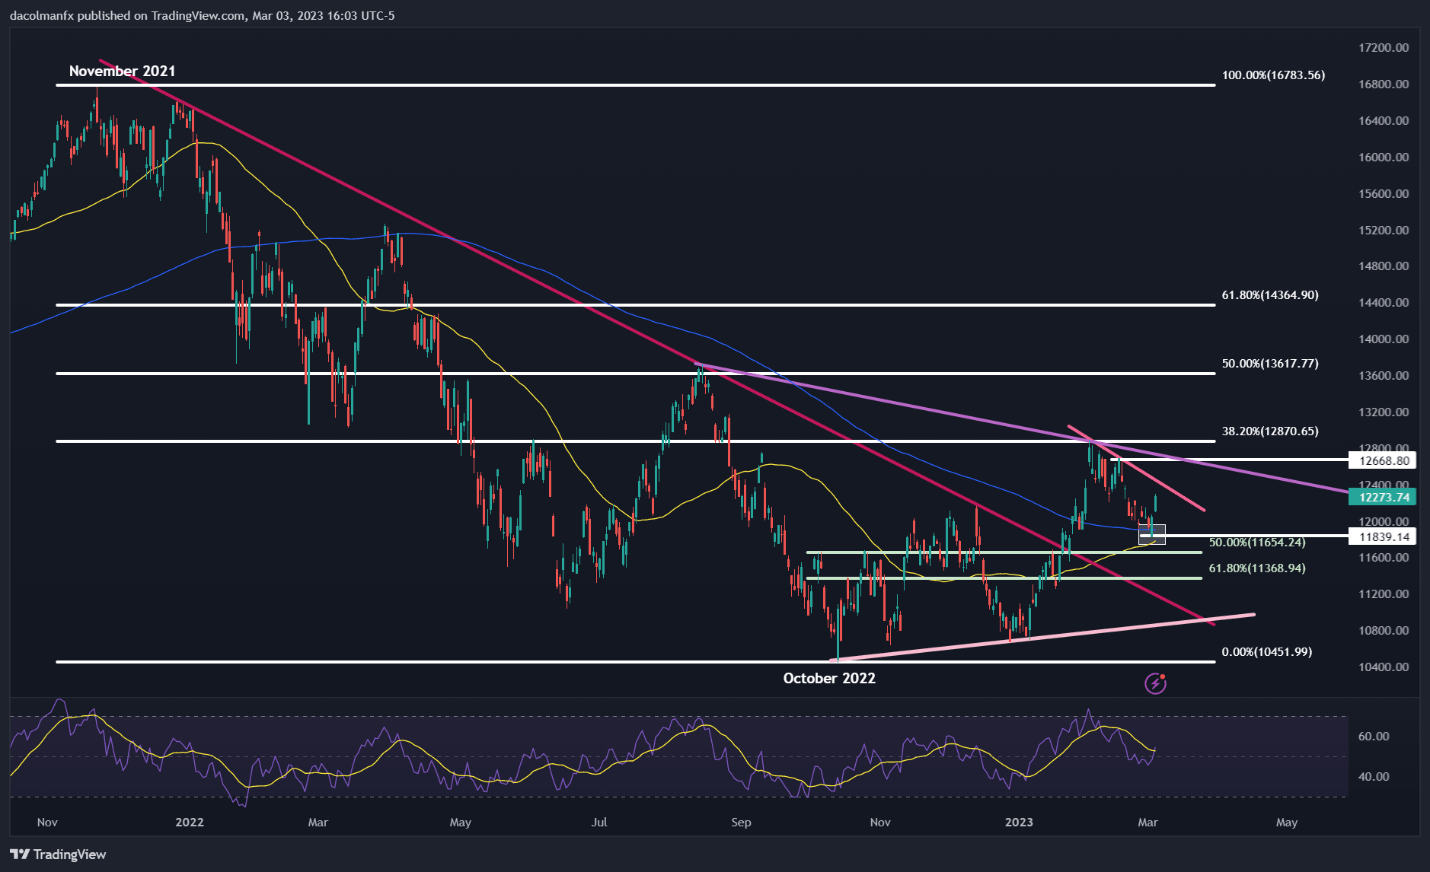
Nasdaq 100 Chart Prepared Using TradingView
Written by Diego Colman, Contributing Strategist for DailyFX


