
USD/JPY FORECAST:
- USD/JPY maintains a constructive outlook in the near term
- Rate differentials between the United States and Japan will continue to be supportive of the U.S. dollar
- This article looks at key technical levels worth watching in USD/JPY over the coming sessions

Most Read: Manufacturing PMI Rises but Stays in Contractionary Territory, US Dollar Pares Drop
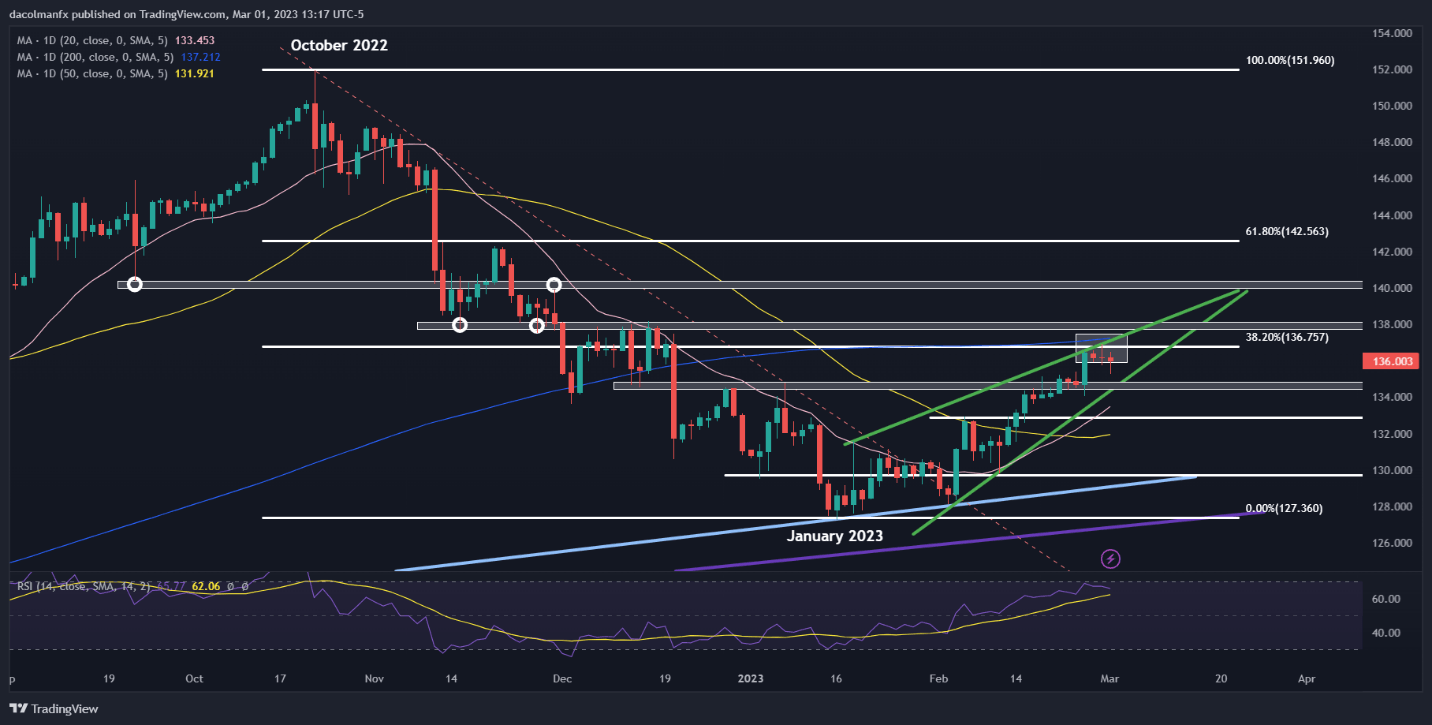
USD/JPY (U.S. dollar – Japanese yen) has been in a massive uptrend since early 2021. Last year, gains accelerated, with the pair briefly breaking above 150.00 and hitting its best level since 1990 in late October. That vertical rise was followed by a rapid and large downward correction, which took the exchange rate below 130.00 by mid-January this year. Bulls, however, resurfaced and reasserted themselves over the last several weeks, paving the way for the U.S. dollar to resume its ascent against its Japanese counterpart.
USD/JPY’s recent recovery may have legs to run higher, especially if U.S. Treasury rates remain in an upward trajectory. For context, yields have shot up over the past month bolstered by a hawkish repricing of the Fed’s hiking path amid hotter-than-expected U.S. economic data, including CPI and labor market results. This morning, for example, the US 10-year yield momentarily recaptured the 4.0% level, the highest since November 2022, after the February ISM manufacturing survey revealed a sharp increase in prices paid by goods producers, a negative omen for the inflation outlook.
Meanwhile, Japanese bond yields have remained subdued as the Bank of Japan has been unwilling to alter its dovish stance. In fact, incoming BOJ Governor Kazuo Ueda has said that now may not be the time to abandon ongoing policies given current economic circumstances, a sign that the institution plans to stick to massive quantitative easing for the foreseeable future without significantly adjusting the yield curve control scheme. This means monetary policy will continue to be a headwind for the yen, limiting its appeal in the FX space.
USD/JPY VS SPREAD BETWEEN US & JAPANESE 10-YEAR BONDS
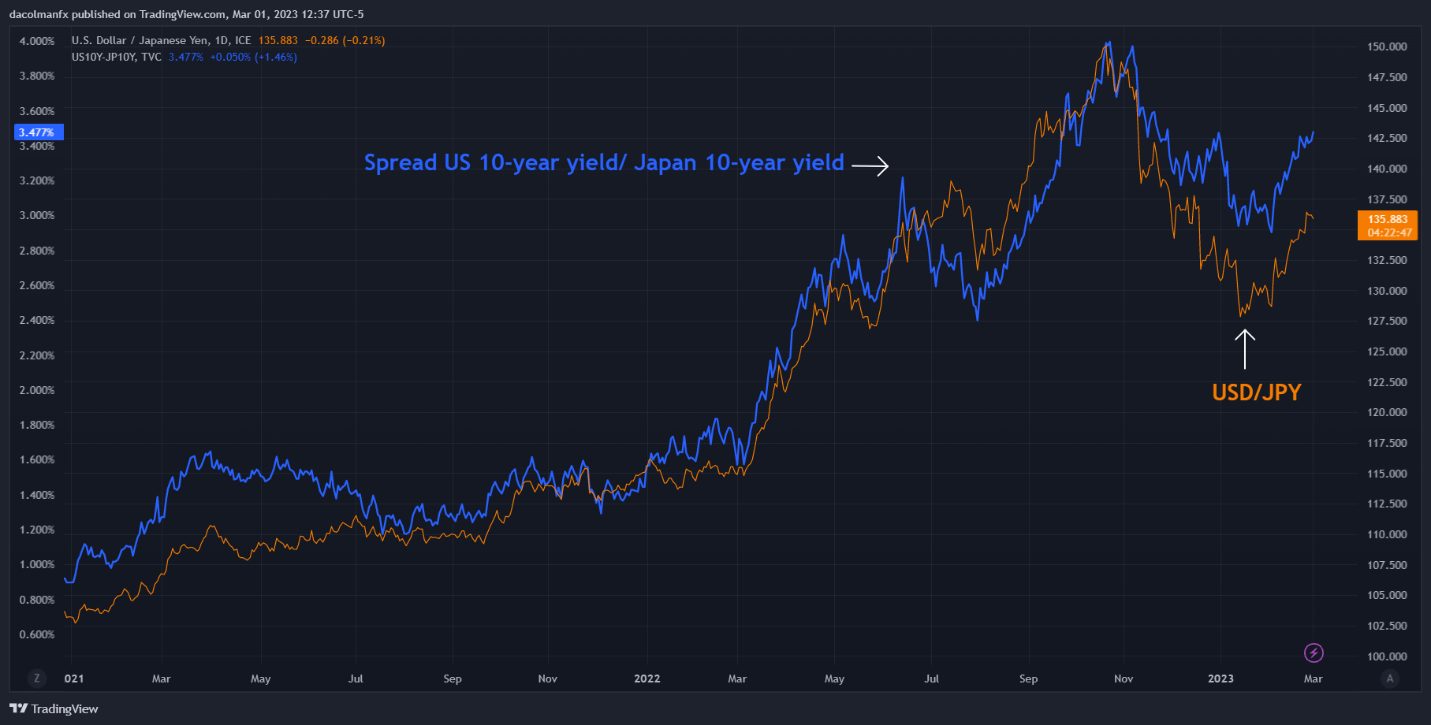
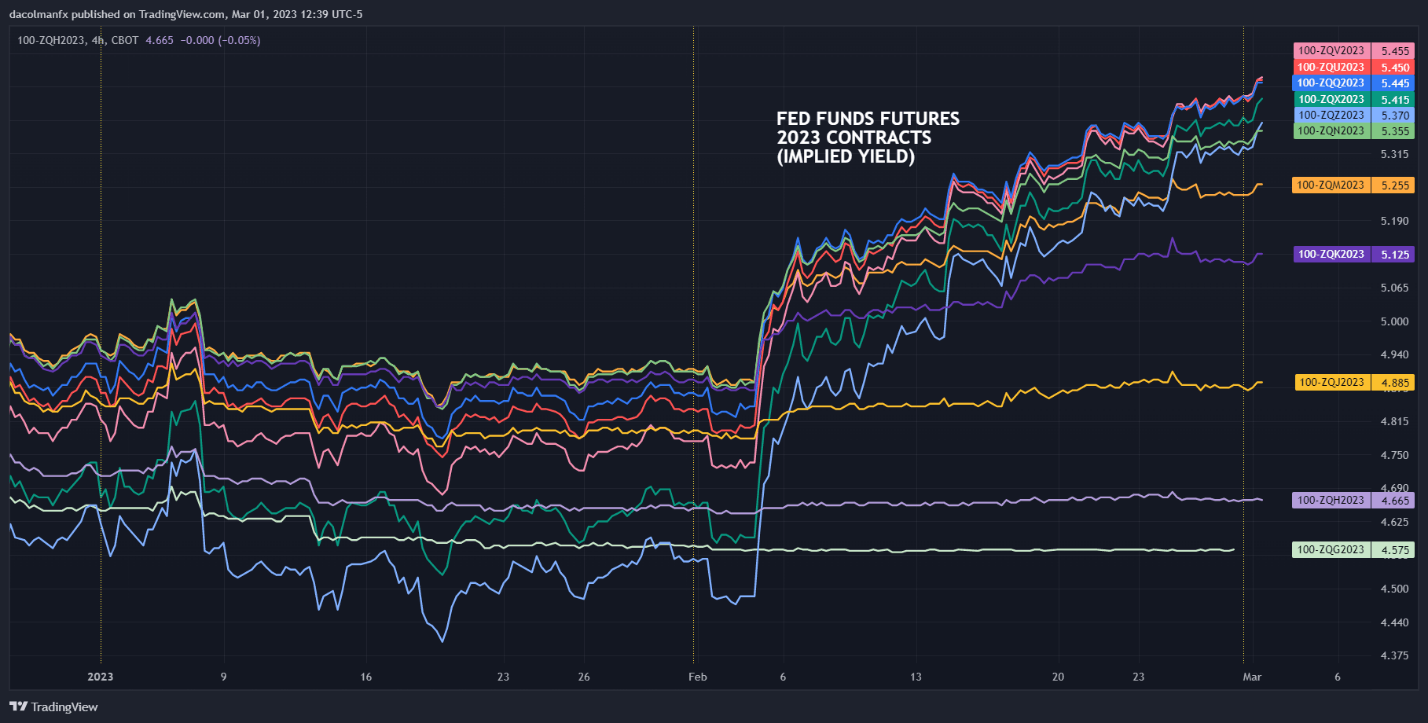
Overall, the outlook for the U.S. dollar looks more constructive than the Japanese currency in the near term, at least from a fundamental point of view. This dynamic will stay in place so long as traders continue to price in a higher Fed terminal rate and a longer tightening cycle (see chart below for reference).
2023 FED FUNDS FUTURES IMPLIED YIELD CHART
In terms of technical analysis, USD/JPY is hovering below cluster resistance near 136.75/137.20, where the 38.2% Fibonacci retracement of the October 2022/January 2023 correction converges with the 200-day simple moving average. If this barrier is taken out resolutely, bulls could launch an assault on the psychological 138.00 level, followed by 140.00. On the flip side, if sellers regain decisive control of the market and drive the exchange rate lower, initial support is seen at 134.65. Below this floor, the next area of interest can be found around 132.85.
| Change in | Longs | Shorts | OI |
| Daily | -2% | 2% | 0% |
| Weekly | 12% | -16% | -6% |
USD/JPY TECHNICAL CHART