


US STOCK MARKET OUTLOOK:
- The S&P 500 rebounds after at sharp sell-off at the market open
- Alphabet and Microsoft shares tumble on disappointing quarterly results, but bearish sentiment is offset by a steep pullback in Treasury yields
- All eyes will be on the U.S. third quarter GDP report and earnings from Amazon and Apple on Thursday
Trade Smarter - Sign up for the DailyFX Newsletter
Receive timely and compelling market commentary from the DailyFX team
Most Read: Has the US Dollar Peaked? Double Top Breakdown Sinks to Support
The S&P 500 made a remarkable turnaround and rose slightly in afternoon trading Wednesday, coming within a whisker of regaining the 3,900 level, after suffering heavy losses at the cash open in the wake of poor corporate results from two tech giants.
Disappointing results and guidance from mega-cap Alphabet and Microsoft, which sent their shares tumbling more than 5% and pointed to a deteriorating economic environment for U.S. companies, initially set a negative tone for equity futures, but the mood improved throughout the day as U.S. bond rates and the U.S. dollar extended their decline that began yesterday.
Over the past two days, the 10-year U.S Treasury yield has fallen more than 25 basis points to 4.0%, pushing the DXY index down nearly 2%, reducing the risk to earnings for multinationals, with large revenues in other countries, that have had to cope with adverse currency fluctuations in recent months (dollar strength).
The pullback in yields, which undoubtedly benefits technology sector valuations, was reinforced by today's monetary policy decision by the Bank of Canada. For context, the institution led by Tiff Macklem surprised investors by raising borrowing costs less-than-forecast, a sign of waning appetite to continue on an aggressive tightening path.
While the narrative is in a flux, many traders are betting that the Fed could soon follow suit, slowing the pace of interest rate rises and adopting a less hawkish bias amid rapidly slowing economic activity and growing fears of a recession. Admittedly, this is not yet a pivot, but it would be the first step in that direction, a very positive scenario for Wall Street.
Looking ahead, there are high-impact events on the U.S. calendar Thursday. First off, third-quarter GDP data due out in the morning should get a lot of attention for clues on the strength of the American consumer, with a weak report increasing the probability of a less forceful FOMC. In the afternoon, investors are likely to stay laser focused on quarterly earnings from Apple (AAPL) and Amazon (AMZ).

S&P 500 TECHNICAL ANALYSIS
After the recent rally, the S&P 500 appears to be approaching a key technical resistance near the 3,900 area. If bulls manage to breach this ceiling, sentiment could improve and bring more buyers to the market, paving the way for a move towards 4,000, the 50% Fibonacci retracement of the 2022 sell-off.
On the flip side, if the recovery stalls and prices are rejected decisively from current levels, initial support comes in at 3,810. On further weakness, we can’t rule out a retest of the 3,725 floor.
S&P 500 TECHNICAL CHART
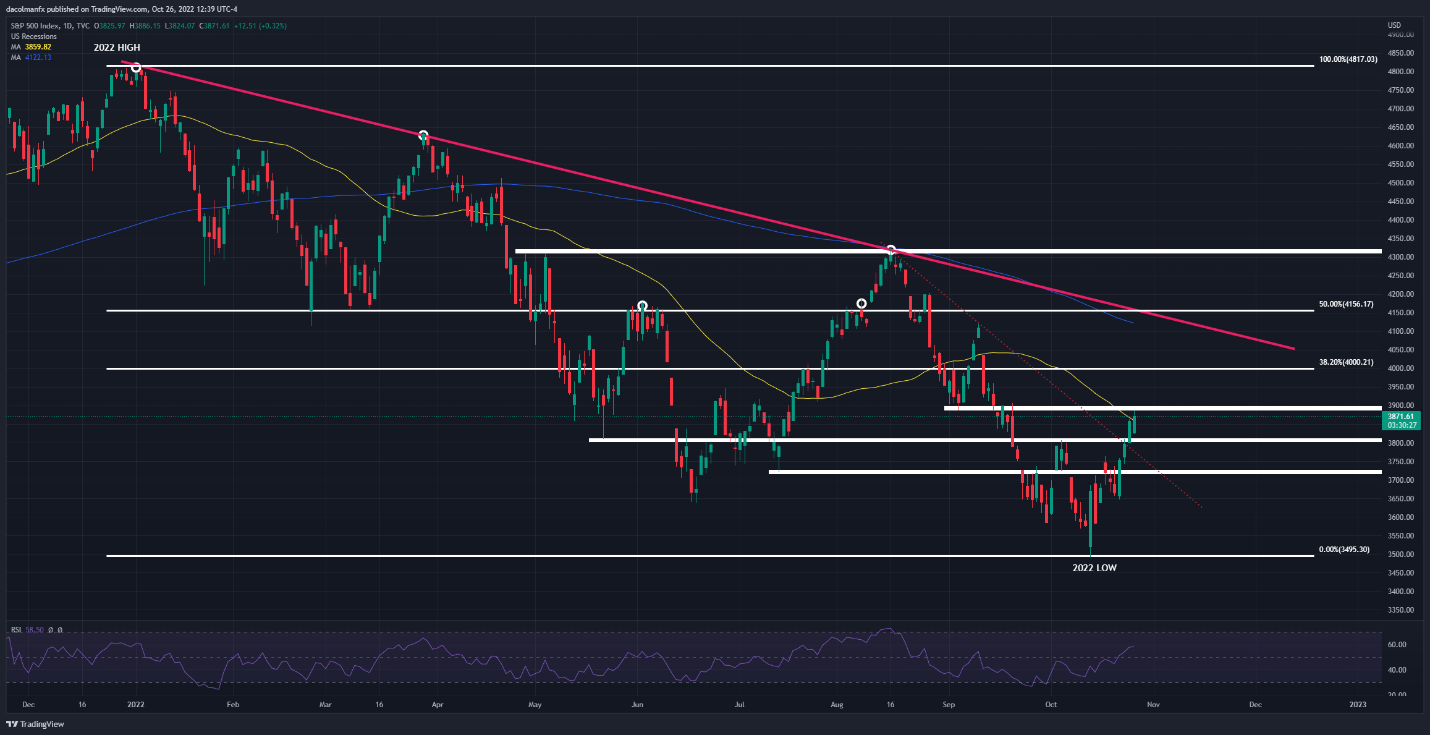
S&P 500 Chart Prepared Using TradingView
EDUCATION TOOLS FOR TRADERS
- Are you just getting started? Download the beginners’ guide for FX traders
- Would you like to know more about your trading personality? Take the DailyFX quiz and find out
- IG's client positioning data provides valuable information on market sentiment. Get your free guide on how to use this powerful trading indicator here.
---Written by Diego Colman, Market Strategist for DailyFX


