


S&P 500, VIX, Financial Stability, USDJPY, GBPUSD and USDCNH Talking Points:
- The Market Perspective: USDJPY Bearish Below 141.50; Gold Bearish Below 1,680
- The second half of this past week proved very different than its first half with financial stability concerns growing out of the IMF meetings, BOE stimulus withdrawal and Dollar’s charge
- Financial stability is my top concern over the coming week but key events like China’s 3Q GDP, Netflix earnings and UK CPI will feed our data appetites

Market Volatility is the Principal Concern
There are those that consider themselves acolytes of fundamentals and technicals, but those are not the only market influences for which traders need to keep track. I am a firm believer that ‘market conditions’ is an overriding influence of the financial system with notable distortion on whether technical levels or event risk will render a definitive impact or target assets or not. At present, the market’s sensitivity to risk trends and propensity for volatility is a top concern. The flippancy that can generate was on full display this past week. Through the first half of the week, the anticipation for the Thursday US CPI seemed to cast a restricting fog over the global markets. While the headline figure’s push to four decade highs was impressive in economic terms, it wasn’t exactly a dramatic shift in the course of systemic fundamentals. That said, lifting the veil of anticipation allowed for volatility to unfold. The ‘anchor’ that this represents was represented well in the transition from an exceptionally quiet stretch pre-CPI and an enormous charge in volatility after the release. To demonstrate the influence of that expectation factor, the 2 to 10 day ATR (average true range) offers meaningful context. That said, there are few, high profile listings in the week ahead that would be expected to waylay the natural evolution of risk trends.
Chart of S&P 500 with 20-Day SMA, 1-Day Range of Change, 2 to 10-Day ATR Ratio (Daily)
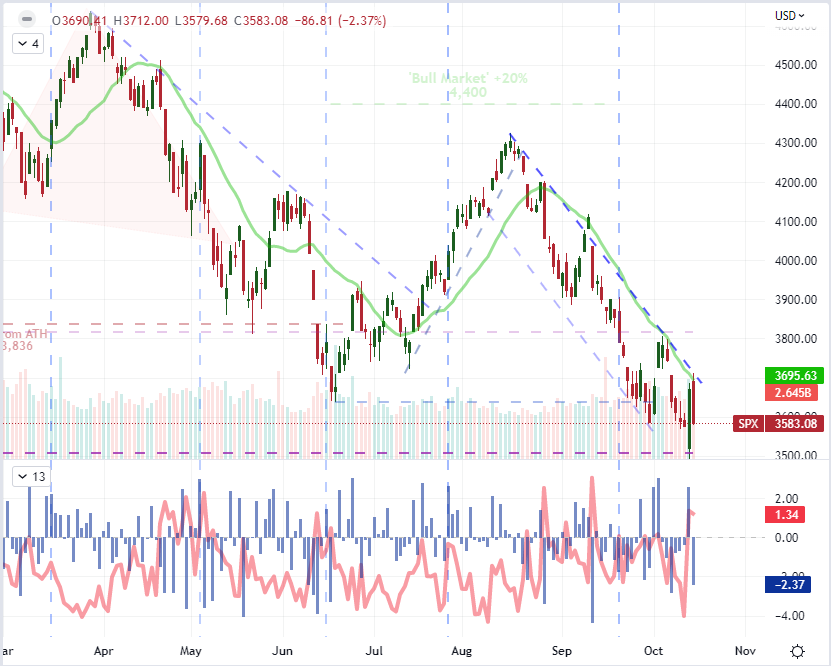
Chart Created on Tradingview Platform
Shifting our assessment of the market’s broader influences, there are two general forces for which we need to follow: contemporary factors and seasonal influences. In the former column, we have: the threat of recession, purposefully-restrictive monetary policy and an abundance of pressure points to trigger systemic threats. From the latter perspective, the expectations around seasons could not put us in a worse situation. While the 42nd week of the year (which are moving into) has averaged a retreat from the typical peak (which connects to this last week) we don’t have to abide that granular average. In fact, we had a higher peak in VIX around March and May of this year when historically the month of October has rendered the peak for volatility back to 1980. Nevertheless, market participants are on guard due to the norms of the financial system as well as the particulars of our current financial situation. Ultimately, this registers as a reason for caution for me.
Chart of Average S&P 500, Volume and Volatility by Month
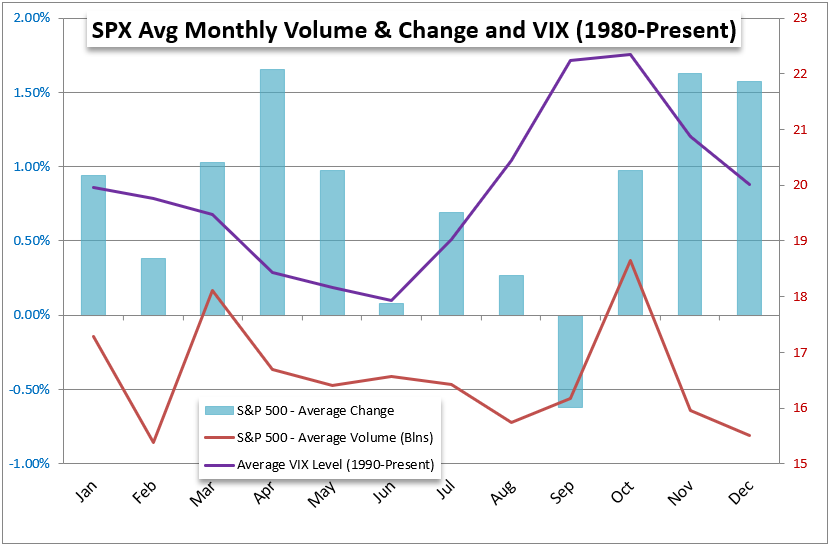
Chart Created by John Kicklighter
Beware the Threats to Financial System
In historical collapses in the financial system that spread to the broader economy, the accused catalyst for the ultimate collapse tends to differ while the underlying circumstances are generally the same. The true problem as I see it is the excess exposure to risk via notional leverage or general distribution of capital to outlets that represents greater risk than market participants afford the effort. There is a line of potential threats to our stability at present, but it is important to take a moment to appreciate the backdrop. After a decade-plus of stimulus that has pushed investors into a deep sense of complacency whereby central banks are seen as flighty dealers of stimulus, the realization of a market that is on its own is taking time to filter through. Yet, ever Fed official’s warning that inflation is the principal focus is slowly making the lights click on. As the awareness grows, one of the areas most remarkable for me is the pressure that is being exacted by the US Dollar’s unrelenting climb. The world’s most liquid currency and largest unit of payment cannot push to multi-decade highs without serious repercussions. Pair that against a currency like the British Pound, which has faced bald financial uncertainty with the government’s fiscal plans, and there is the capacity of extreme volatility. At the end of this past week, the UK PM seemed to u-turn on the mini budget proposed just a few weeks before, but we should remain hyper aware of the market’s assessment of the situation with the Bank of England pulling back the safety net. GBPUSD will be a top focus for me this week.

Chart of GBPUSD with 100-Day SMA, Overlaid with UK-US 2 Year Yield Spread (Daily)
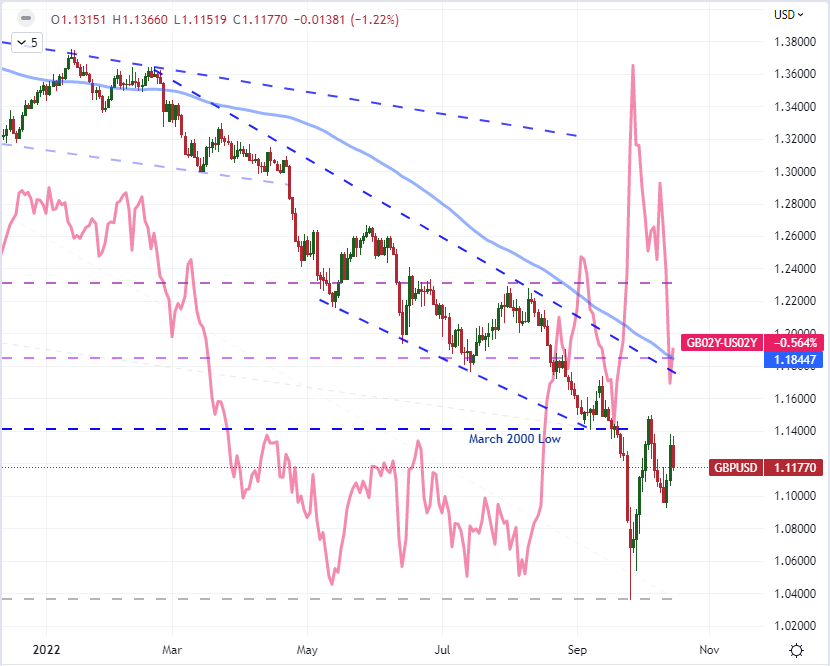
Chart Created on Tradingview Platform
Another over threat to the stability of the global financial markets is the USDJPY’s push higher. Through Friday’s close, the world’s second most liquid currency pair notched an eighth consecutive daily advance. That matches the longest stretch of gains for the cross stretching back to 2011. On a weekly basis, the charge is 9 consecutive candles’ advance which has only two other such comparable moves back to February 2013. Ultimately, the progress is more remarkable for its defiance of external attempts to cap the market. This exchange rate – an extreme contrast of monetary policy and clear threat to an export-dependent economy – is pushing highs not seen since 1990. What’s more, it defies the efforts of Japanese authorities to impart some measure of control. Back on September 22nd, the Japanese Ministry of Finance attempted to prop up the Yen (push USDJPY lower), but the effort lasted a single day. If the markets don’t believe the authorities can exert influence when it is needed, stability is fundamentally unmoored.

Chart of USDJPY with 20-Week SMA and Consecutive Candle Count (Weekly)
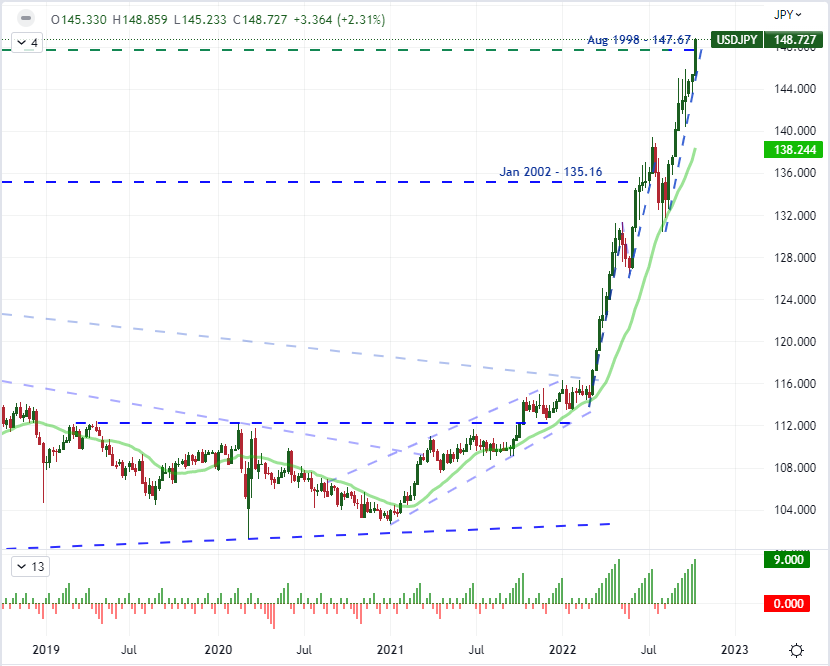
Chart Created on Tradingview Platform
The Top Scheduled Event Risk Ahead
While financial stability is my top concern in the week ahead, that is a fundamentally unpredictable backdrop to deal with. If I were operating on a more regimented diet of scheduled event risk, I would have to say that this week’s docket is much lighter on singularly-influential events than what we just witnessed. Lacking a CPI, NFPs or FOMC may be frustrating for calendar watchers; but it can also allow for market development rather than have the ‘potential’ of a future release cap the evolution of market value. Among those events that I do find important, UK inflation will stir some deep concerns while US earnings is regularly headline worthy. This week’s corporate reporting is less concentrated than the banks run this past Friday; but the release of performance metrics from Netflix (FAANG member and symbolic risk measure), CSX (shipping company and GDP proxy) and Tesla (autos and market cap giant) can throw some serious weight around in impressions.
Critical Macro Event Risk on Global Economic Calendar for Next Week
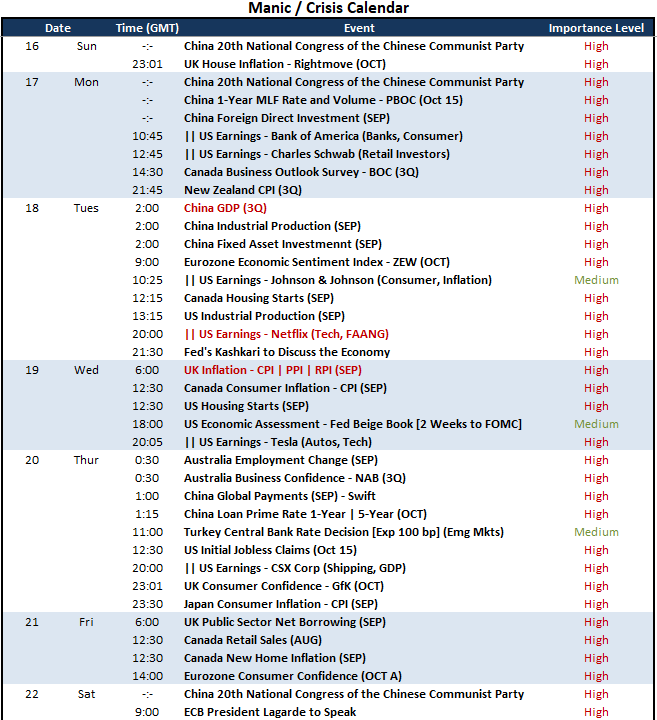
Calendar Created by John Kicklighter
For scheduled event risk and high pressure perspective, I think it is worth calling out USDCNH this week. In liquidity terms, this is still not among the top liquidity exchange rates – even those the US and China are the first and second largest economies respectively. Nevertheless, the pair closed at its highest level – on a daily and weekly basis – since 2008. There has been some serious misgivings on the financial and economic health of China (a country that managed to avert the 2008 Great Financial Recession) which further boosts the traditional appetite for safety that benefits the dollar. With a run of important September data, 3Q Chinese GDP stats and the National People’s Congress ahead; this is a global macro area to watch.
Chart of USDCNH with 20-Week SMA with Spot-20-Week Differential (Weekly)
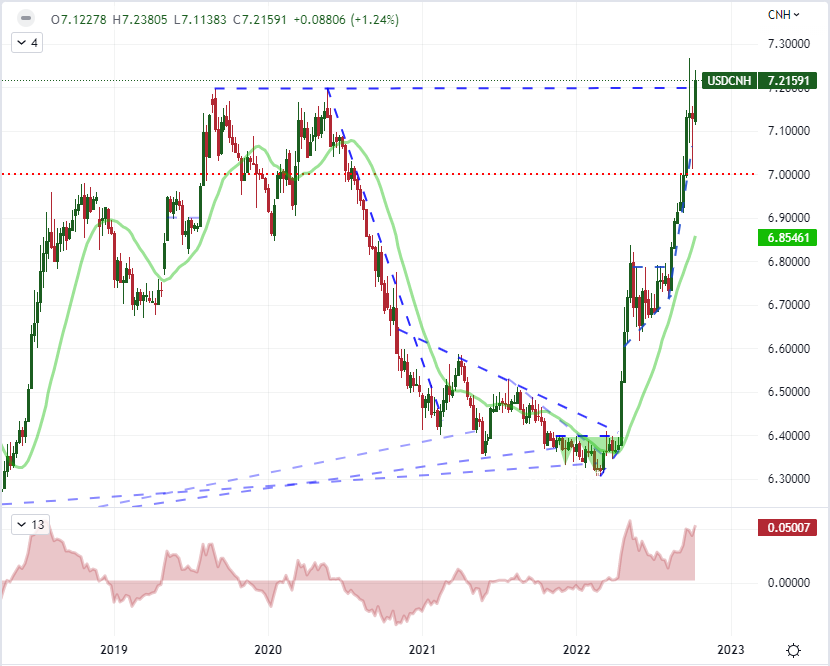
Chart Created on Tradingview Platform
Trade Smarter - Sign up for the DailyFX Newsletter
Receive timely and compelling market commentary from the DailyFX team


