


STOCK MARKET KEY POINTS:
- The S&P 500 and Nasdaq 100 decline for the second day in a row amid rising U.S. Treasury rates
- Yields move higher on better-than-expected U.S. economic data
- All eyes are now on the FOMC policy decision Wednesday afternoon
Trade Smarter - Sign up for the DailyFX Newsletter
Receive timely and compelling market commentary from the DailyFX team
Most Read: Central Bank Watch - Fed Speeches, Interest Rate Expectations Update; November Fed Meeting Preview
U.S. stocks erased morning gains and closed moderately lower on Tuesday, extending losses from the previous session, weighed down by a rise in U.S. Treasury rates, with the 2-year yield charging towards its cycle highs following stronger-than-expected U.S. economic data.
First, the JOLTS survey showed that job openings surged in September, rising to 10.72 million, well ahead of estimates calling for a total of 9.85 million. This sturdy outturn indicates that there are 1.9 vacancies for every available worker, a sign that the labor market remains extremely tight despite the Federal Reserve’s best efforts to weaken hiring momentum. Second, manufacturing activity slowed less than expected in October, clocking in at 50.2 compared to a forecast of 50.00, pointing to resiliency in the goods-producing sector.
When it was all said and done, the S&P declined 0.41% to 3,856, with telecommunications and consumer discretionary leading the retrenchment. Meanwhile, the Nasdaq 100 plunged 1.02% to 11,289, undermined by a sell-off in Amazon (AMZN) and Alphabet shares (GOOG).
From a broader perspective, the constructive macro data released this morning suggest that demand has not yet cooled significantly to curb inflationary pressures, indicating that the Fed may have the margin to step on the brakes a little harder and for a little longer to restore price stability.

Traders will get a chance to assess the FOMC’s hiking outlook on Wednesday when the institution announces its November decision. Policymakers are seen raising borrowing costs by 75 basis points to 3.75-4.0%, the most restrictive range since early 2008. This move is fully discounted, so the focus will be on guidance, bearing in mind that this meeting does not include macroeconomic projections.
Judging by recent commentary, it is possible that the bank could fine-tune its message and prepare the market for a shift into a slower pace of tightening. However, this scenario should not be mistaken for a pivot, as a less front-loaded cycle now could just translate to more spread-out hikes in 2023.
In any case, a more cautious and data-dependent approach, which would allow assessing the effects of cumulative tightening on the economy, may be welcomed by Wall Street as an indication that we are past peak Fed hawkishness. This could propel risk assets a little higher. On the other hand, if the Fed maintains an aggressive tone and fails to soften its stance, all bets are off. This scenario could trigger the next leg lower for stocks.
| Change in | Longs | Shorts | OI |
| Daily | 1% | -1% | 0% |
| Weekly | 15% | -13% | -1% |
S&P 500 DAILY CHART
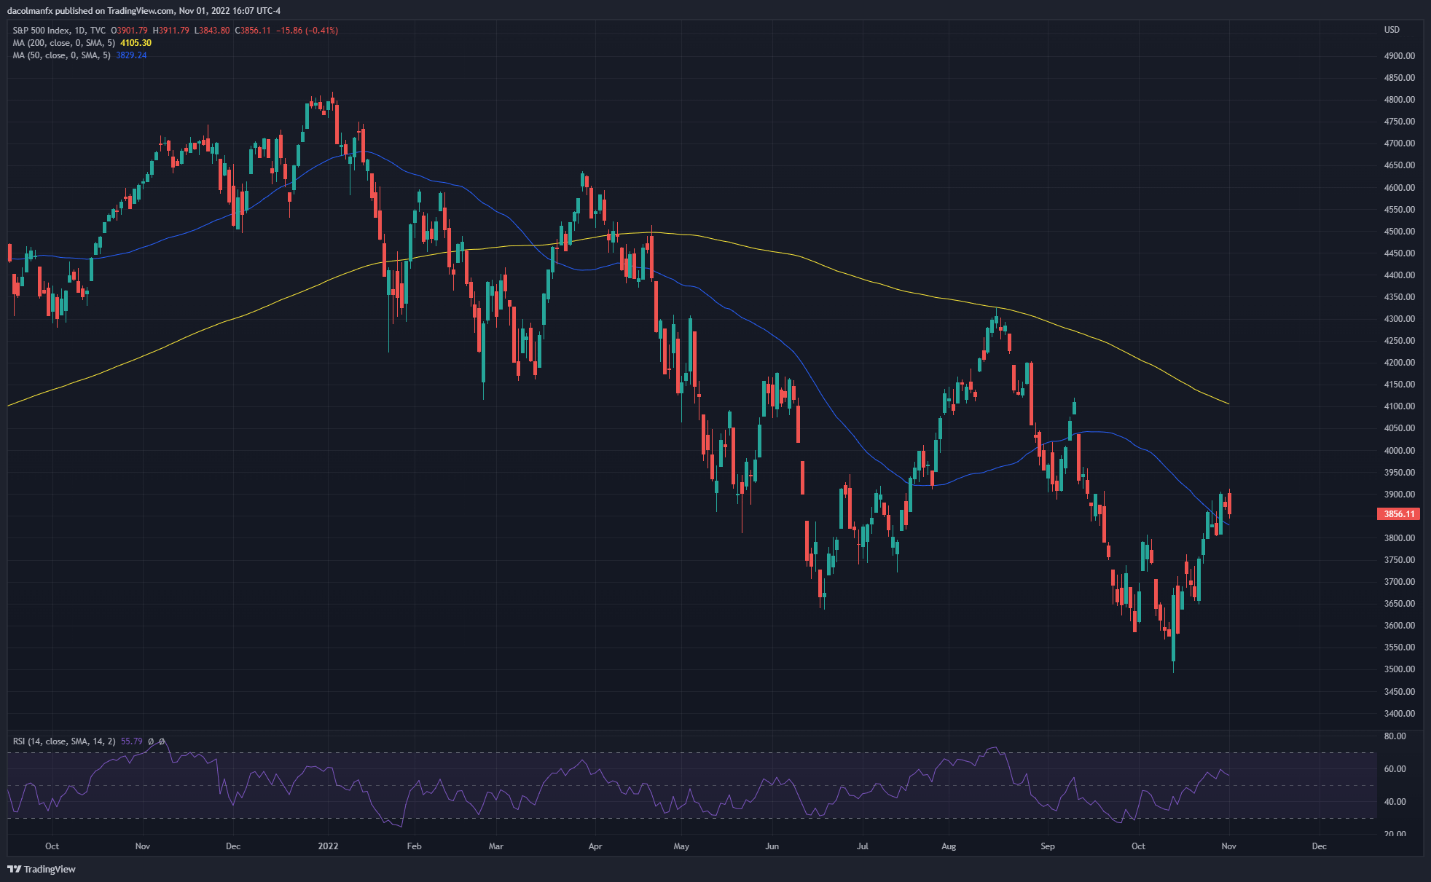
S&P 500 Chart Prepared Using TradingView
EDUCATION TOOLS FOR TRADERS
- Are you just getting started? Download the beginners’ guide for FX traders
- Would you like to know more about your trading personality? Take the DailyFX quiz and find out
- IG's client positioning data provides valuable information on market sentiment. Get your free guide on how to use this powerful trading indicator here.
---Written by Diego Colman, Market Strategist for DailyFX


