


S&P 500 and Nasdaq 100 – Fundamental Forecasts and Analysis
- Equity markets end the week in negative territory as recession fears grow.
- US earnings season cranks up a gear.

US equity markets have had a shortened week to forget about with the S&P 500 and the Nasdaq 100 both in negative territory overall. Increased fears that the US economy is in, or is close to entering, recession have roiled risk markets. Economic data this week has been mixed to negative, while Federal Reserve rhetoric continues to sound hawkish as Fed board members reiterate that interest rates need to be higher and stay that way for longer. Next week sees the release of flash Q4 US GDP and the latest core PCE figures. These releases will give the markets a clearer picture of the US economy as we near the February 1 FOMC meeting.
For all market-moving events and data releases, see the real-time DailyFX Economic Calendar
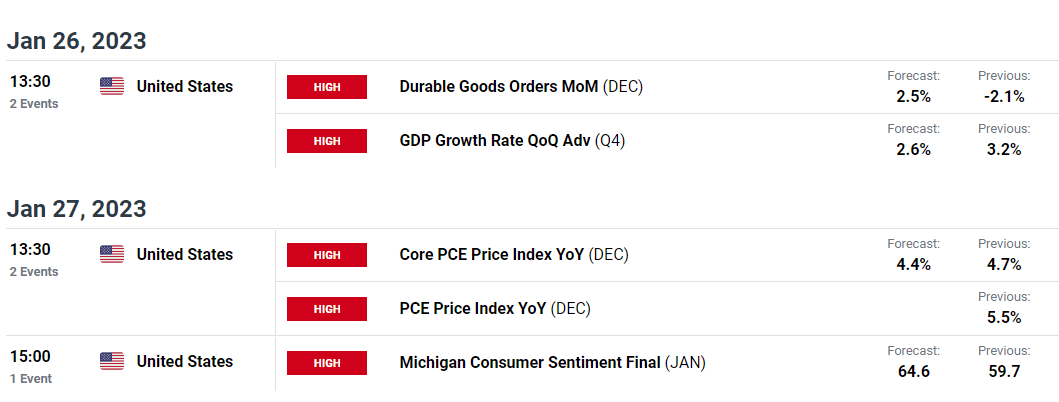
Next week’s US earnings calendar shows a handful of household names set to release their latest figures including, General Electric (GE) and Microsoft (MSFT) on Tuesday, Boeing (BA) and Tesla (TSLA) on Wednesday, and card companies Mastercard (MA) and Visa (V) on Thursday and American Express (AXP) on Friday. Each will give a clue into the health of certain areas of the US economy.
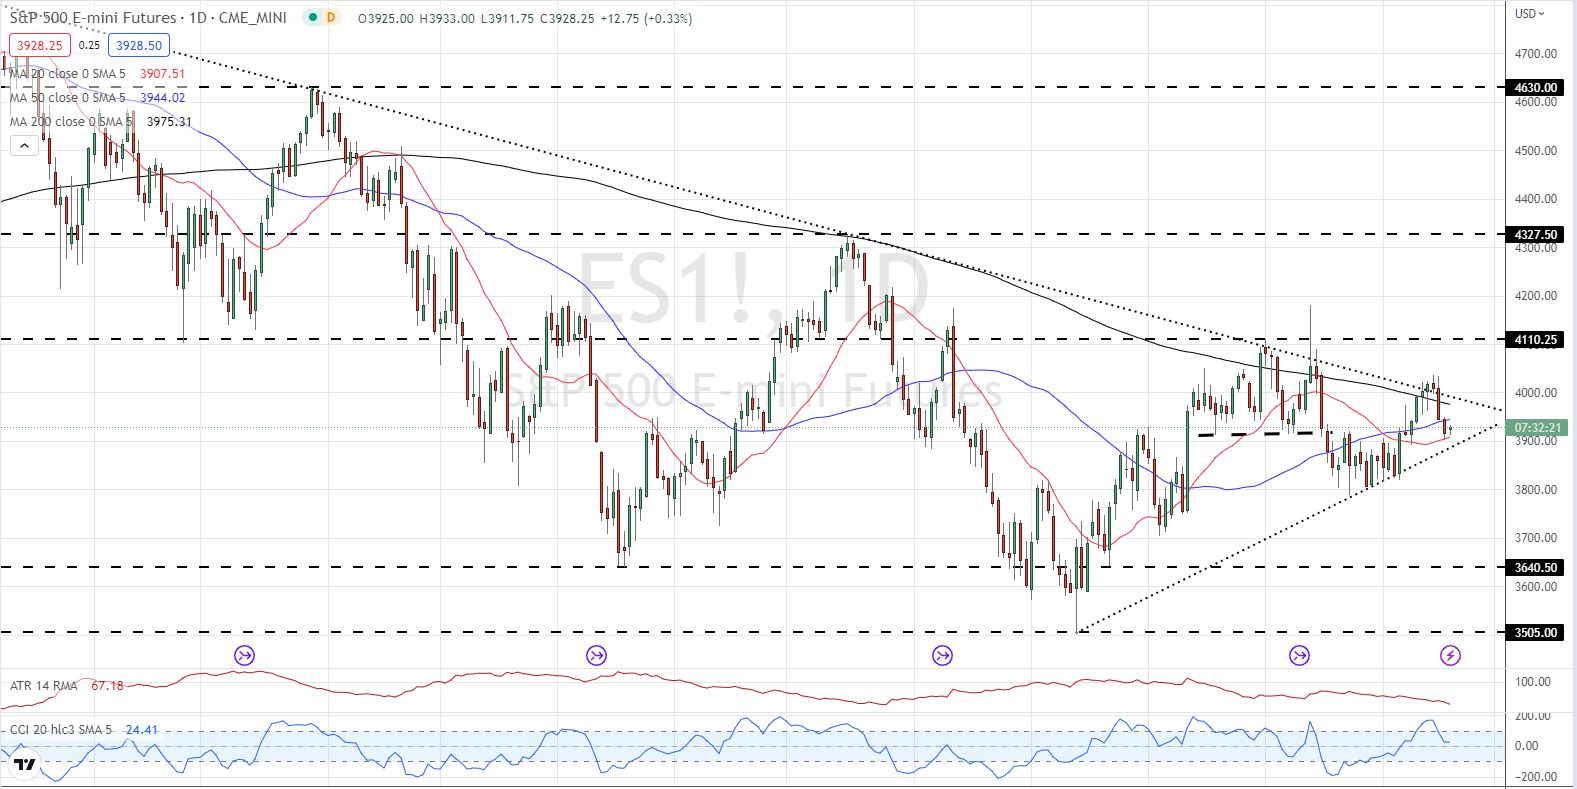
The S&P 500 remains under the influence of the longer-term downtrend and the short-term uptrend. As these two trends come close to their apex, and that is looking likely around the February FOMC meeting, a trend breakout is set to occur.
S&P 500 (ES1!) Price Chart – January 20, 2023
| Change in | Longs | Shorts | OI |
| Daily | 1% | -1% | 0% |
| Weekly | 15% | -13% | -1% |
Retail Trader data show 51.73% of traders are net-long with the ratio of traders long to short at 1.07 to 1.The number of traders net-long is 8.26% higher than yesterday and 14.07% higher from last week, while the number of traders net-short is 6.77% lower than yesterday and 6.26% lower from last week.
We typically take a contrarian view to crowd sentiment, and the fact traders are net-long suggests US 500 prices may continue to fall. Traders are further net-long than yesterday and last week, and the combination of current sentiment and recent changes gives us a stronger US 500-bearish contrarian trading bias.
What is Earnings Season and What to Look for in Earnings Reports?
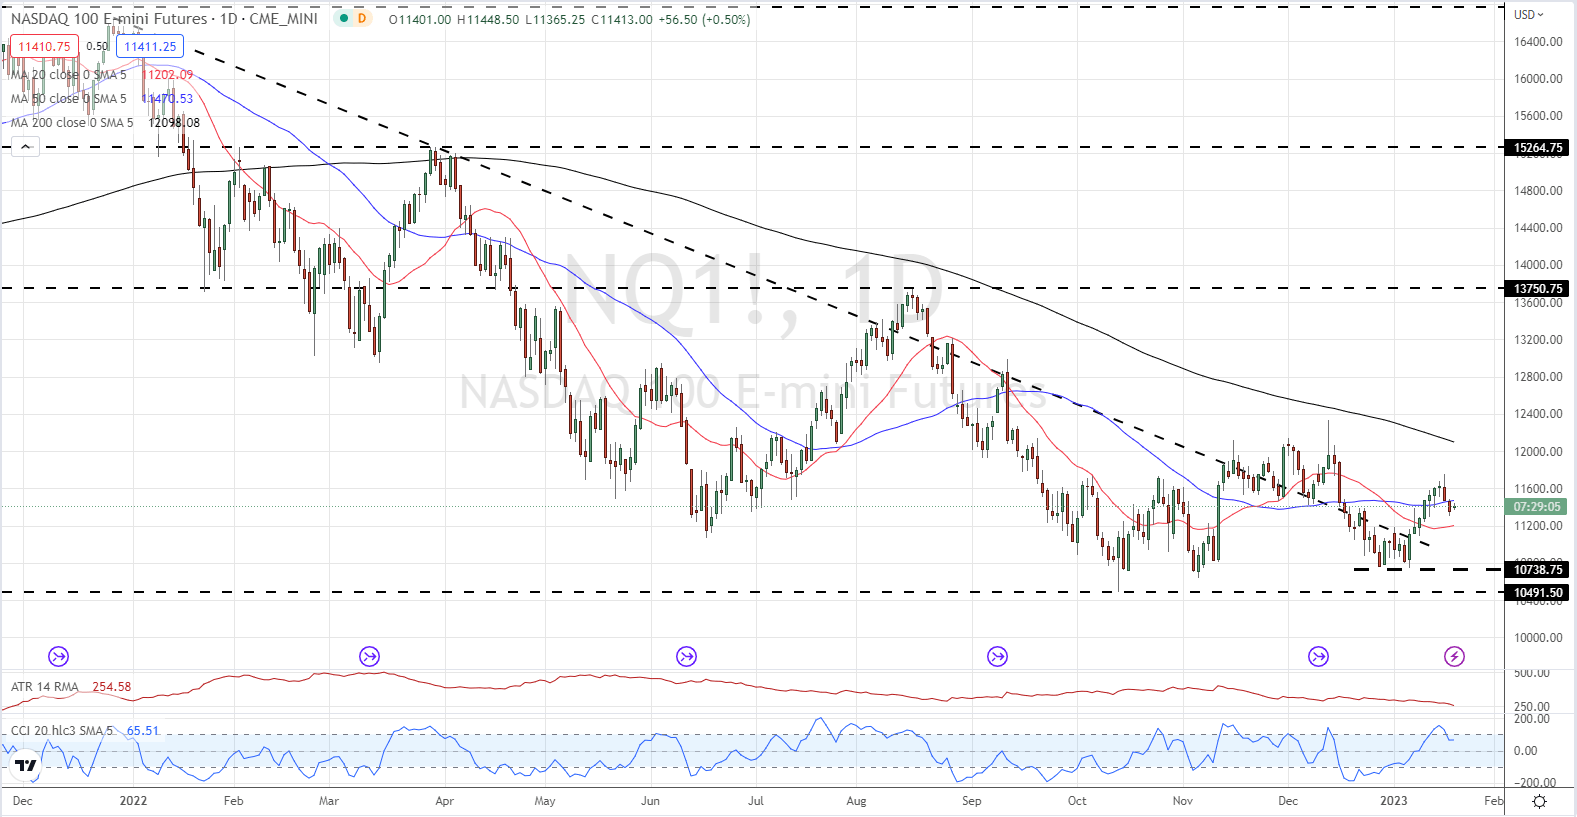
The Nasdaq 100 is above the longer-term downtrend line but remains weak. The indices is back below the 50-day moving average, after briefly breaking above it, while the longer-dated 200-dma remains a distance away and pointing lower.
Nasdaq 100 (NQ1!) Daily Price Chart – January 20, 2023
What is your view on the S&P 500 and the Nasdaq 100 – bullish or bearish?? You can let us know via the form at the end of this piece or you can contact the author via Twitter @nickcawley1.


