
NASDAQ 100 OUTLOOK:
- Nasdaq 100 trades lower on Monday, extending losses from the previous week and sliding more than 1% as bullish sentiment continues to wane
- Despite the recent pullback, the tech index is up more than 35% this year
- This article looks at key Nasdaq 100’s technical levels worth watching in the coming days

Most Read: Japanese Yen Forecast - USD/JPY Pauses after Explosive Breakout. What Now?
The Nasdaq 100 retreated on Monday, extending losses from the previous week, dragged down by heavy selling in the mega cap space. By way of context, Alphabet, Tesla and Nvidia suffered a deep setback as bullish sentiment continued to wane, hurting companies that have benefited from the “artificial intelligence” frenzy over the past few months.
In early afternoon trading, the technology index was down about 1.05% to 14,900, reversing the 0.9% gain registered earlier in the day. Despite the recent decline, the Nasdaq 100 is still the top performer on Wall Street in 2023, up more than 35% year-to-date, leaving the S&P 500, the Dow Jones Industrial and the Russell 2000 in the dust by a wide margin.
Looking ahead, technology stocks may be in for a bumpy ride as reality sets in. That said, the Fed's aggressive rate-hiking cycle, slowing economic activity and thinning liquidity should play against risk assets moving into the summer, especially if the U.S. central bank sticks to its guidance and delivers additional tightening during the second half of the year as part of its fight against inflation.
You May Like: Gold Price Latest - XAU/USD Nudges Higher as US Bond Yields Turn Lower
While the economy has been resilient, it will struggle to stay afloat for much longer if rates stay above 5% for too long. Once the impact of tighter policy feeds through the system more fully, cracks will emerge, creating a hostile environment for equities. At this point, assets that drifted away from fundamentals and reached frothy valuations during the 2023 rally will be vulnerable to a deeper downward correction.
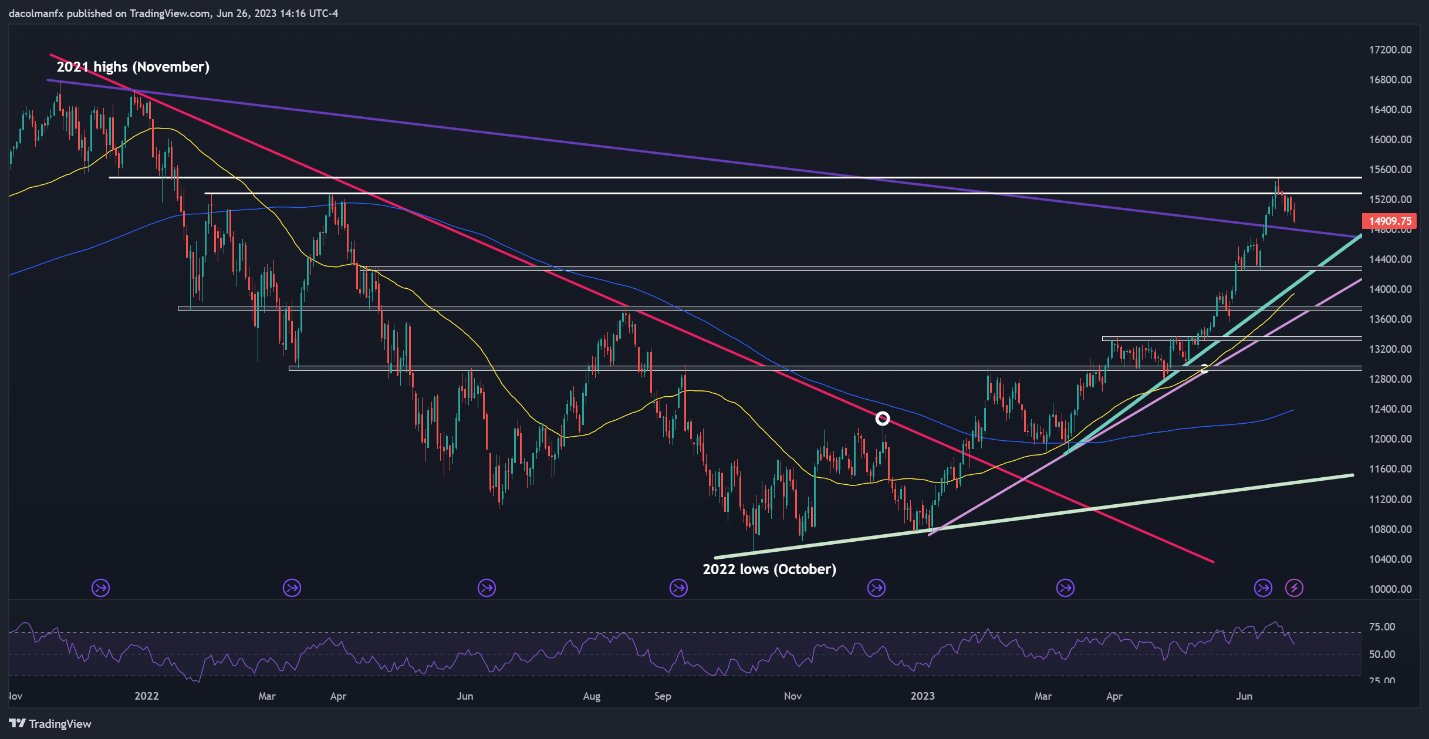
From a technical standpoint, if the Nasdaq 100 extends its recent slide, initial support appears at 14,800, but further losses may be in store on a dip below this area, with the next downside target at 14,300, followed by the psychological 14,000 level. On the contrary, if dip buyers return and spark a reversal, overhead resistance lies at 15,275 and 15,500 thereafter.

NASDAQ 100 TECHNICAL CHART