


Gold Price (XAU/USD) Analysis, Price, and Chart
- US Treasury yields slip lower despite a hawkish Federal Reserve.
- Retail traders remain long of gold.

For all market-moving data releases and events, see the DailyFX Economic Calendar
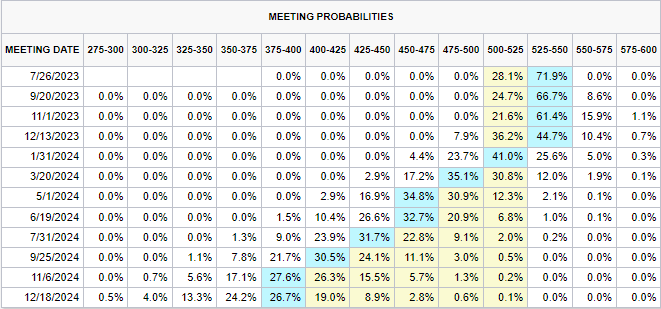
US Treasury yields have opened the week lower as fears grow of an upcoming recession in the US. The UST 2-year is 10 basis points lower than Friday’s high at 4.70%, while the UST 10-year is 12 basis points lower at 3.68% over the same timeframe. The near 100 basis point backwardation between the 2s and 10s is a strong recessionary indicator. Despite lower bond yields, US interest rates are seen moving higher. Looking at CME Fed Fund futures, the probability that the US central bank hikes rates by 25 basis points on July 26 is currently at a lofty 72% with no interest rate cuts expected until January 2024.
Markets Week Ahead: Nasdaq, Gold, USD, Powell, US PCE, German IFO, China PMI, Australia Retail Sales
Last week’s testimony by Fed chair Powell did little to dissuade the market that rates may move higher in the future. In his testimony to the House Financial Services Committee last week, Powell said that its was a ‘pretty good guess’ that US interest rates would be raised again as ‘inflation pressures continue to run high’. The battle between a hawkish Fed and a market looking at an impending recession will continue to distort the US yield curve and fuel interest rate volatility.
Gold broke through a prior level of support last week and if this level now turns to resistance, lower gold prices are likely going forward. The important 61.8% Fibonacci retracement level is at $19,904/oz, just above the psychological $1,900/oz point with a 50% retracement of the late-September to early-May rally at $1,849/oz. A push, and consolidation above $1,940/oz. would ease bearish pressure on the precious metal.
Gold Daily Price Chart – June 26, 2023
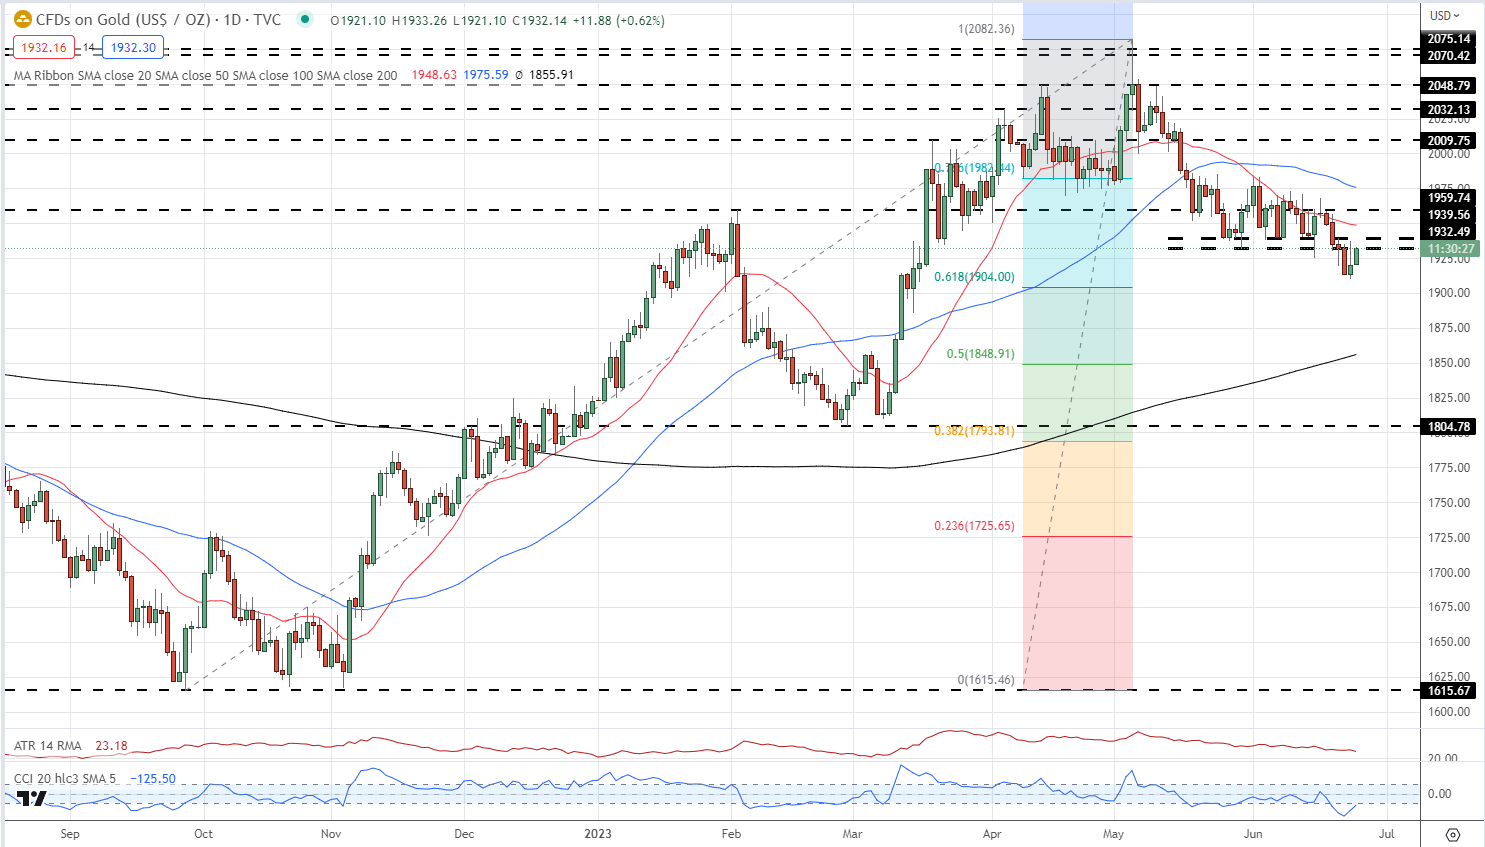
Chart via TradingView
| Change in | Longs | Shorts | OI |
| Daily | -14% | 9% | -4% |
| Weekly | -7% | 6% | -1% |
Retail Traders Remain Net-Long
Retail trader data show 73.92% of traders are net-long with the ratio of traders long to short at 2.83 to 1.The number of traders net-long is 1.59% higher than yesterday and 18.45% higher from last week, while the number of traders net-short is 5.67% higher than yesterday and 22.28% lower from last week.
We typically take a contrarian view to crowd sentiment, and the fact traders are net-long suggests Gold prices may continue to fall. Positioning is less net-long than yesterday but more net-long from last week. The combination of current sentiment and recent changes gives us a further mixed Gold trading bias.
What is your view on Gold – bullish or bearish?? You can let us know via the form at the end of this piece or you can contact the author via Twitter @nickcawley1.


