


NASDAQ 100, NDX, Gold, XAU/USD - OUTLOOK:
- Growing similarities between the Nasdaq 100 index and XAU/USD price charts.
- From a fundamental perspective, elevated real yields appear to be a key driver.
- How is the trend evolving and what are the key levels to watch in the Nasdaq 100 index?

Growing similarities on the charts of the Nasdaq 100 index and gold suggest the former could be in for some consolidation/minor retreat in an environment of rising real yields.
The Nasdaq 100 index has had a spectacular run since the beginning of the year, rising nearly 50%. The absolute levels of the index and momentum on lower timeframe charts mask the developments on higher timeframe charts. Just as the index approaches its 2021 record high, momentum on higher timeframe charts has been feeble. Such situations typically raise the odds of a dead-cat bounce, rather than a start of a new trend (uptrend in this case). That is, the chances are that the rally from early 2023 is part of a larger correction that began in 2021.
Nasdaq 100 Index Monthly Chart
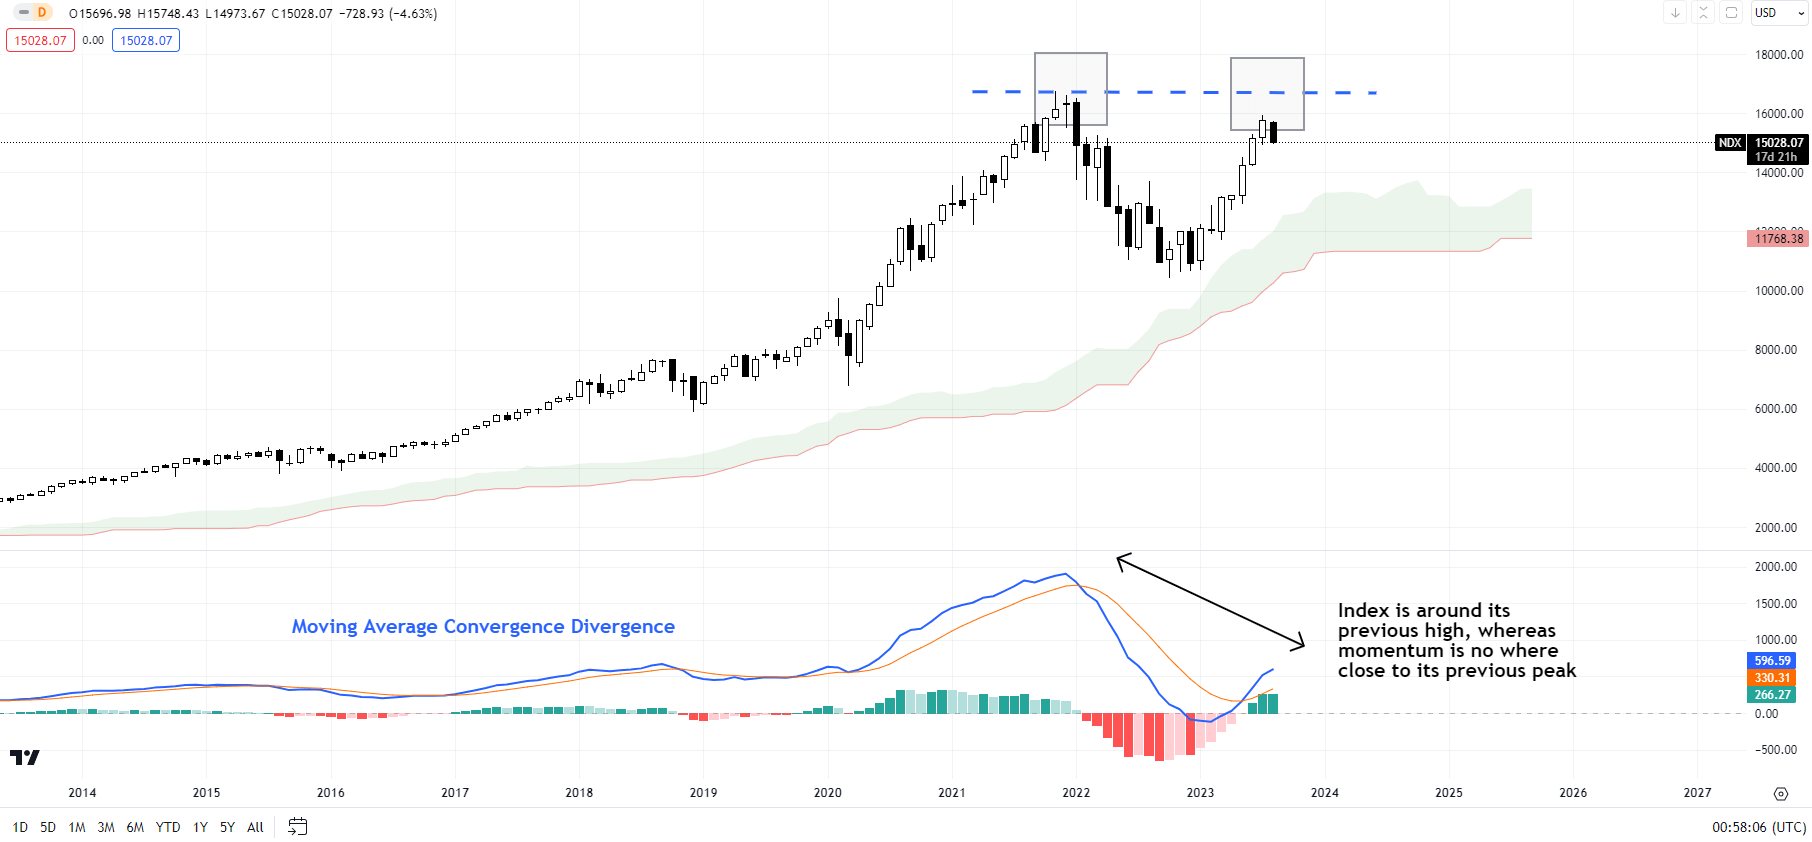
Chart Created by Manish Jaradi Using Tradingview
A similar development took place on the monthly charts of gold – first highlighted in Q2-2023. See “Gold Could Find It Tough to Crack $2000,”published March 28, and “Gold Weekly Forecast: Is it Time to Turn Cautious on XAU/USD?” published April 16. Subsequently, XAU/USD failed to decisively clear its previous 2020 and 2022 peaks. The yellow metal is now threatening to break below crucial support on the 200-day moving average. For more discussion, see “Gold, Silver Forecast: It’s Now or Never for XAU/USD, XAG/USD,” published August 13.
XAU/USD Monthly Chart
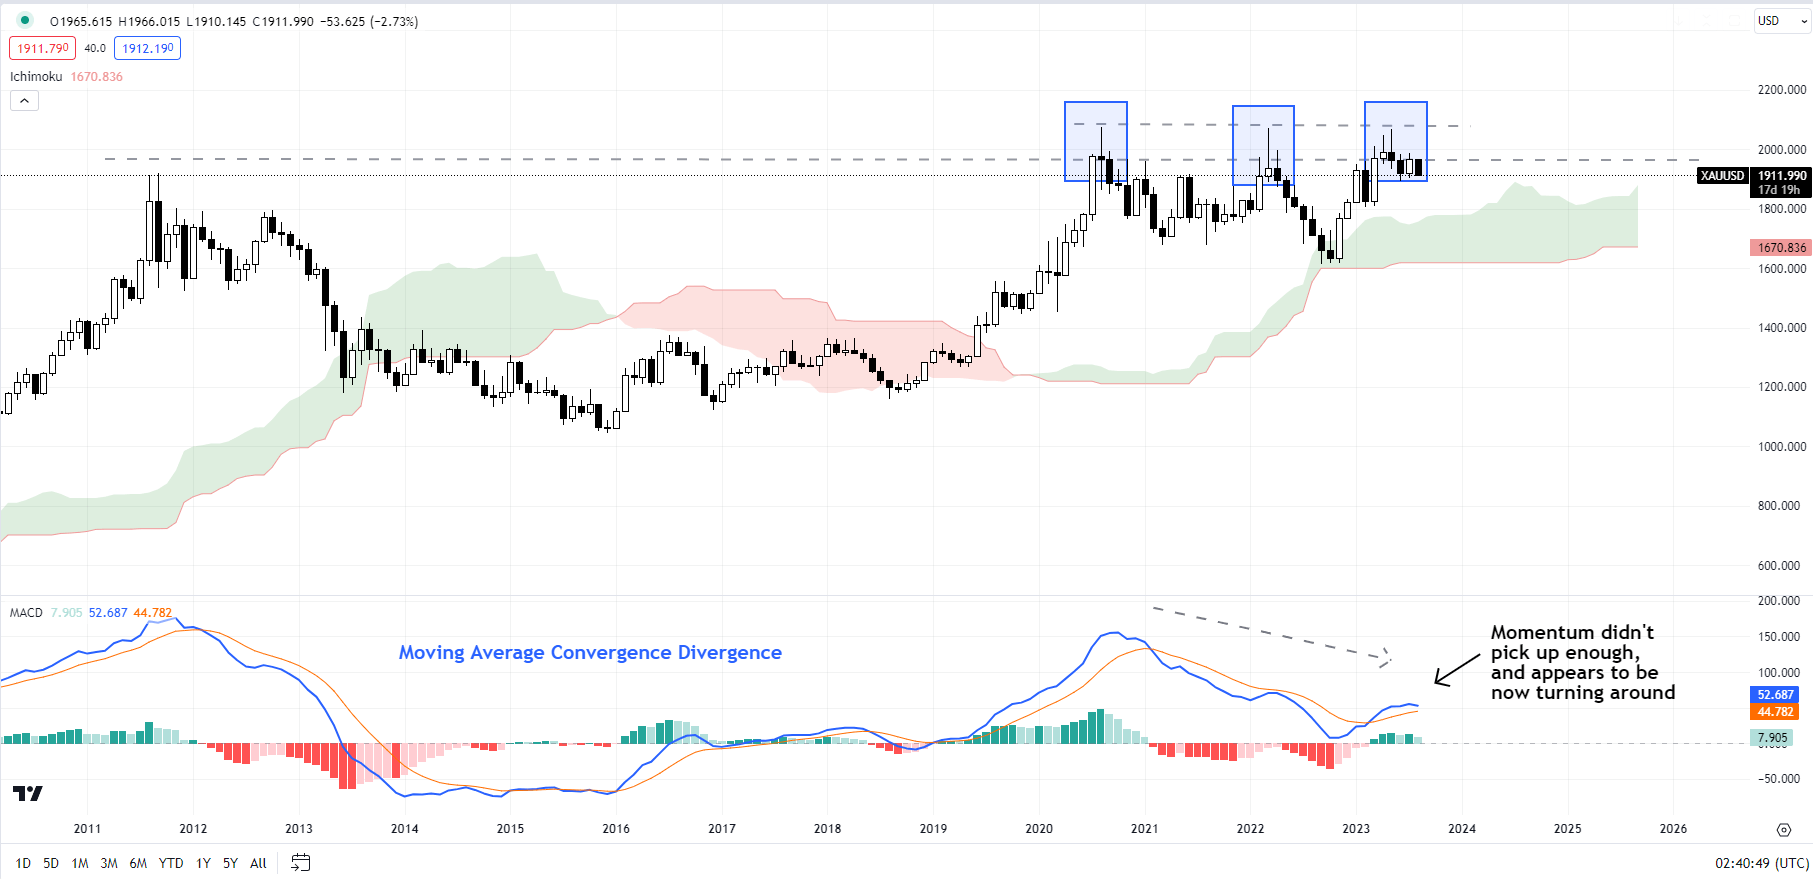
Chart Created by Manish Jaradi Using Tradingview
Besides price charts, the real yields could be the common thread between the two markets. The surge in real yields appears to be the most recent driver pressurizing gold. As highlighted in an update last week, real yields have been elevated on rising nominal interest rates, moderating price pressures/inflation expectations amid the growing perception of the higher-for-longer interest rates. See “High Real Yields Starting to Bite Gold? XAU/USD Price Setup Ahead of US CPI,” published August 10.
Nasdaq 100 Daily Chart
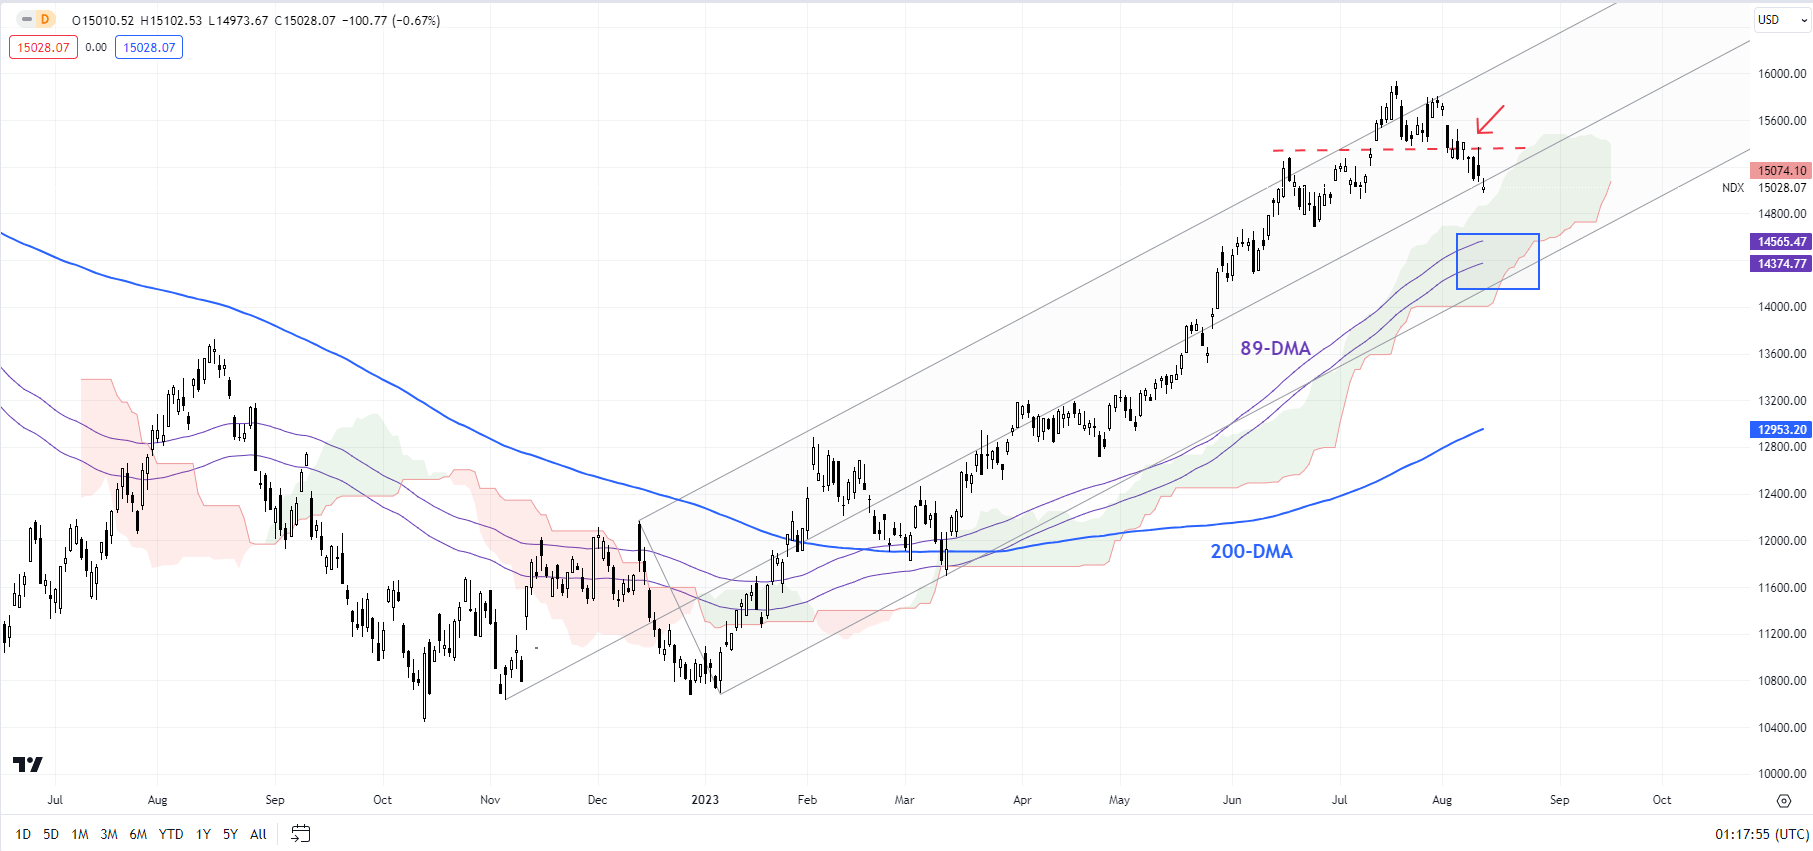
Chart Created by Manish Jaradi Using Tradingview
Equities thrived in an environment of near-zero interest rates and negative real rates. However, the rising cost of capital and positive real rates imply that the hurdle for equities to outperform other asset classes is now higher, especially with valuations above historical averages. Positive real rates have increased the opportunity cost of holding the non-yielding yellow metal, leading to its underperformance in recent months.
XAU/USD Daily Chart
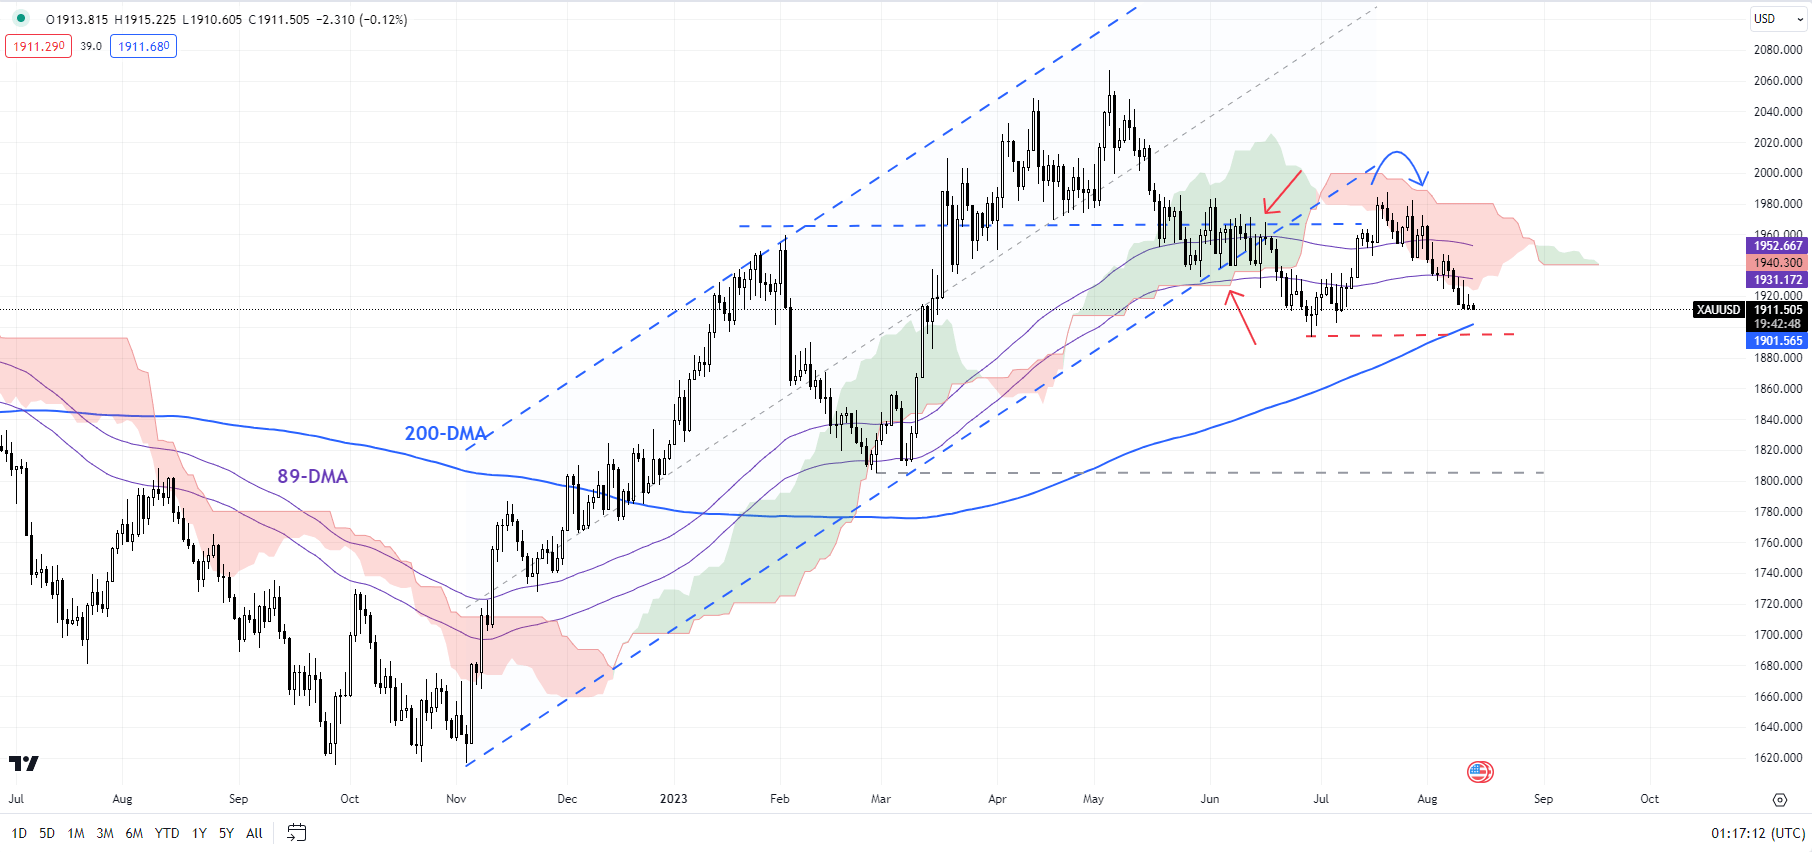
Chart Created by Manish Jaradi Using Tradingview
On its own, the Nasdaq 100 index's rally appears to be losing steam. For more discussion on US indices' trend, see "US Indices Rally Beginning to Crack? S&P 500, Nasdaq Price Setups," published August 3. Moreover, the fall last week below minor support at the late-July low of 15375 suggests cracks could be developing on the Nasdaq 100 index’s rally. This follows a failure to decisively rise above the upper edge of a rising channel from late 2022.
A similar development on the gold daily charts in May pushed XAU/USD toward its 89-day moving average, near the lower edge of the Ichimoku cloud on the daily charts. For the Nasdaq 100 index, the 89-day moving average and the lower edge of the Ichimoku cloud currently stand around 14000-14400.
To be fair, this doesn’t mean the Nasdaq 100 index has turned imminently bearish. It means the risk: reward for those expecting continued gains doesn’t appear to be as attractive as it was a few months ago.

--- Written by Manish Jaradi, Strategist for DailyFX.com
--- Contact and follow Jaradi on Twitter: @JaradiManish


