


S&P 500, SPX, NASDAQ 100, NDX - OUTLOOK:
- Signs of fatigue on the Nasdaq 100 index charts amid extreme optimism.
- The S&P 500 index has fallen below a support for the first time since April.
- What is the outlook and the key levels to watch in the S&P 500 and the Nasdaq 100 index?

Relatively bigger down days than up days since late July on the daily charts of the Nasdaq 100 index and the S&P 500 index’s fall below support for the first time since April suggests the rally in US indices could finally be due for a breather.
Fitch’s downgrade of US credit rating and higher-for-longer rates following strong US private payroll data appear to be the catalysts for the setback in risk appetite. However, conditions have been getting ripe for at least some consolidation, as highlighted in recent updates. See “S&P 500, Nasdaq 100 Forecast: Overly Optimistic Sentiment Poses a Minor Setback Risk,” published July 23, and “US Equity Indices Post FOMC: Nasdaq, S&P 500, Dow Price Setups,” published July 27.
Despite upbeat US quarterly earnings so far and resilient economic growth, US indices have struggled recently. Extreme optimism, overbought conditions, overcrowded positioning, and poor Q3 seasonality appear to be gradually casting a shadow over the rally.Having said that, it wouldn’t necessarily imply a reversal of the broader uptrend – the rally could well continue. However, from a risk:reward perspective, the bar for sustained gains seems to be rising.
Nasdaq 100 Daily Chart
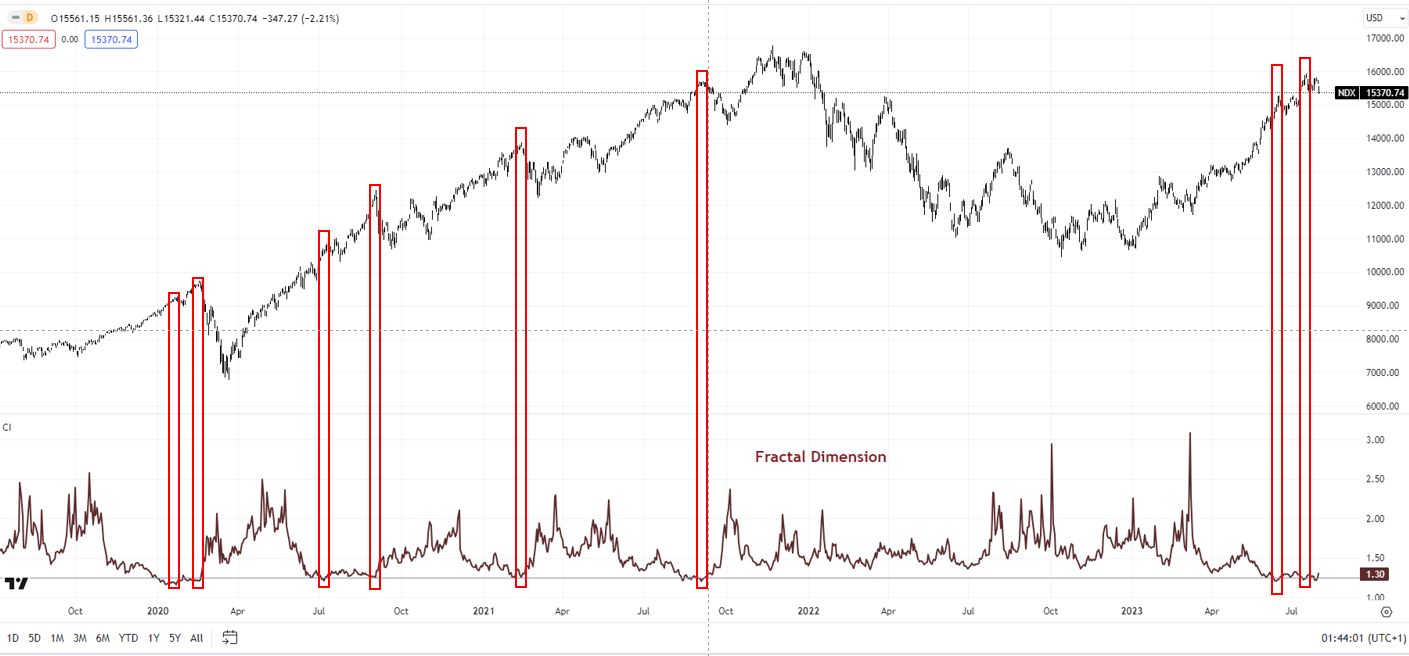
Chart Created by Manish Jaradi Using TradingView
Market diversity as measured by fractal dimensions appears to be low – first highlighted in “Dow, S&P 500, Nasdaq Technical Outlook: No Sign of a Reversal,” published July 9. Fractal dimensions measure the distribution of diversity. When the measure hits the lower bound, typically 1.25-1.30 depending on the market, it indicates extremely low diversity as market participants bet in the same direction, raising the odds of at least a pause/reversal. For the Nasdaq 100 index, the 65-day fractal dimension fell below the threshold of 1.25, flashing a red flag.
Nasdaq 100 240-Minute Chart
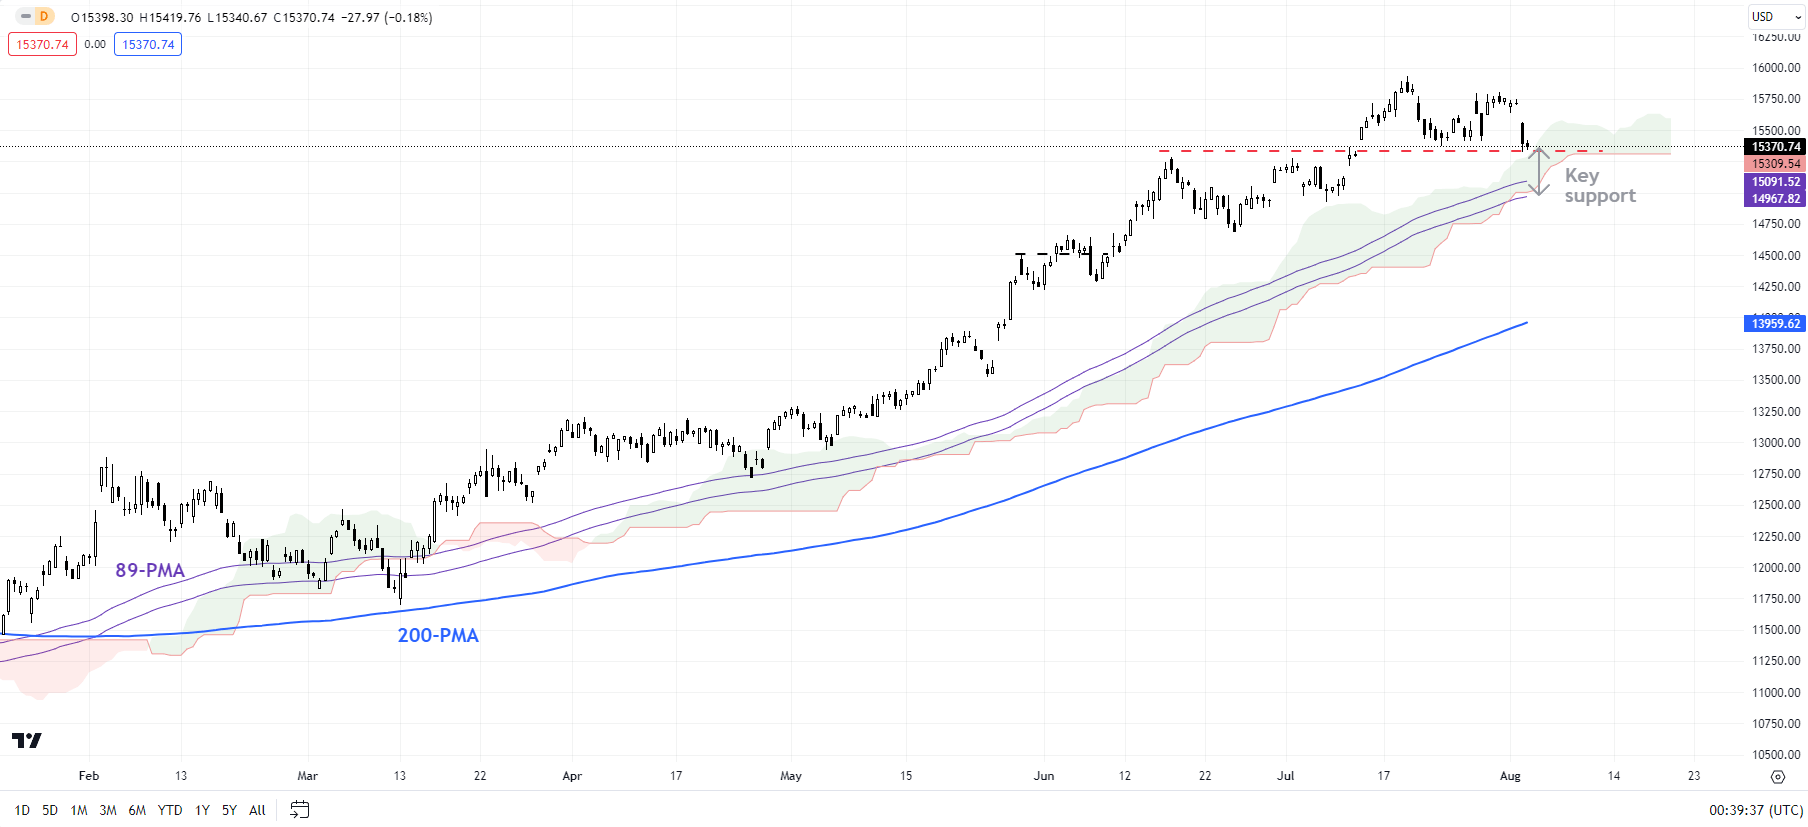
Chart Created by Manish Jaradi Using TradingView
Nasdaq 100: Risks minor retreat
On technical charts, the Nasdaq 100 index’s rally appears to be losing steam as it tests an immediate cushion at the 15285-15385. Also, as noted in arecent update, monthly charts have been feeble compared with the 50% rally since October (see the monthly chart). The strength in upward momentum on the daily and weekly charts perhaps masks the anemic conditions on the monthly charts.
Nasdaq 100 Monthly Chart
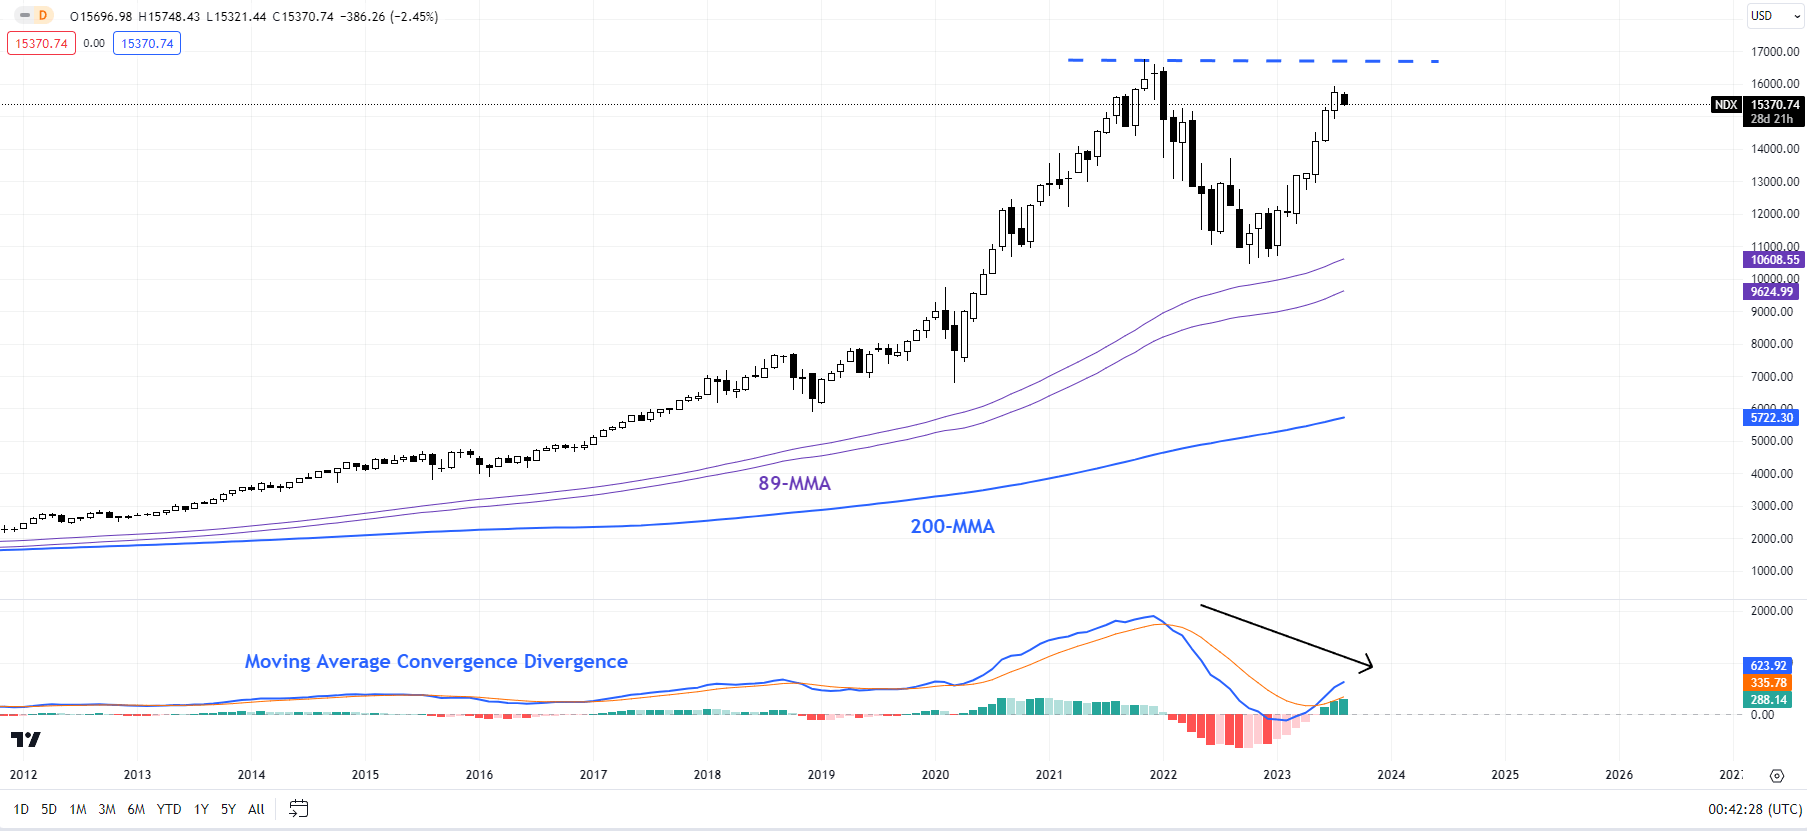
Chart Created by Manish Jaradi Using TradingView
Granted, price action is still unfolding -- and there is no reversal of the broader uptrend yet. However, a failure of momentum to rise on higher timeframe charts would be a sign that the rally since last year was corrective (as part of the broader correction that started in 2022), and not the resumption of the long-term bull market. Any break below 15285-15385 could expose downside risks toward 14500.
S&P 500 240-Minute Chart
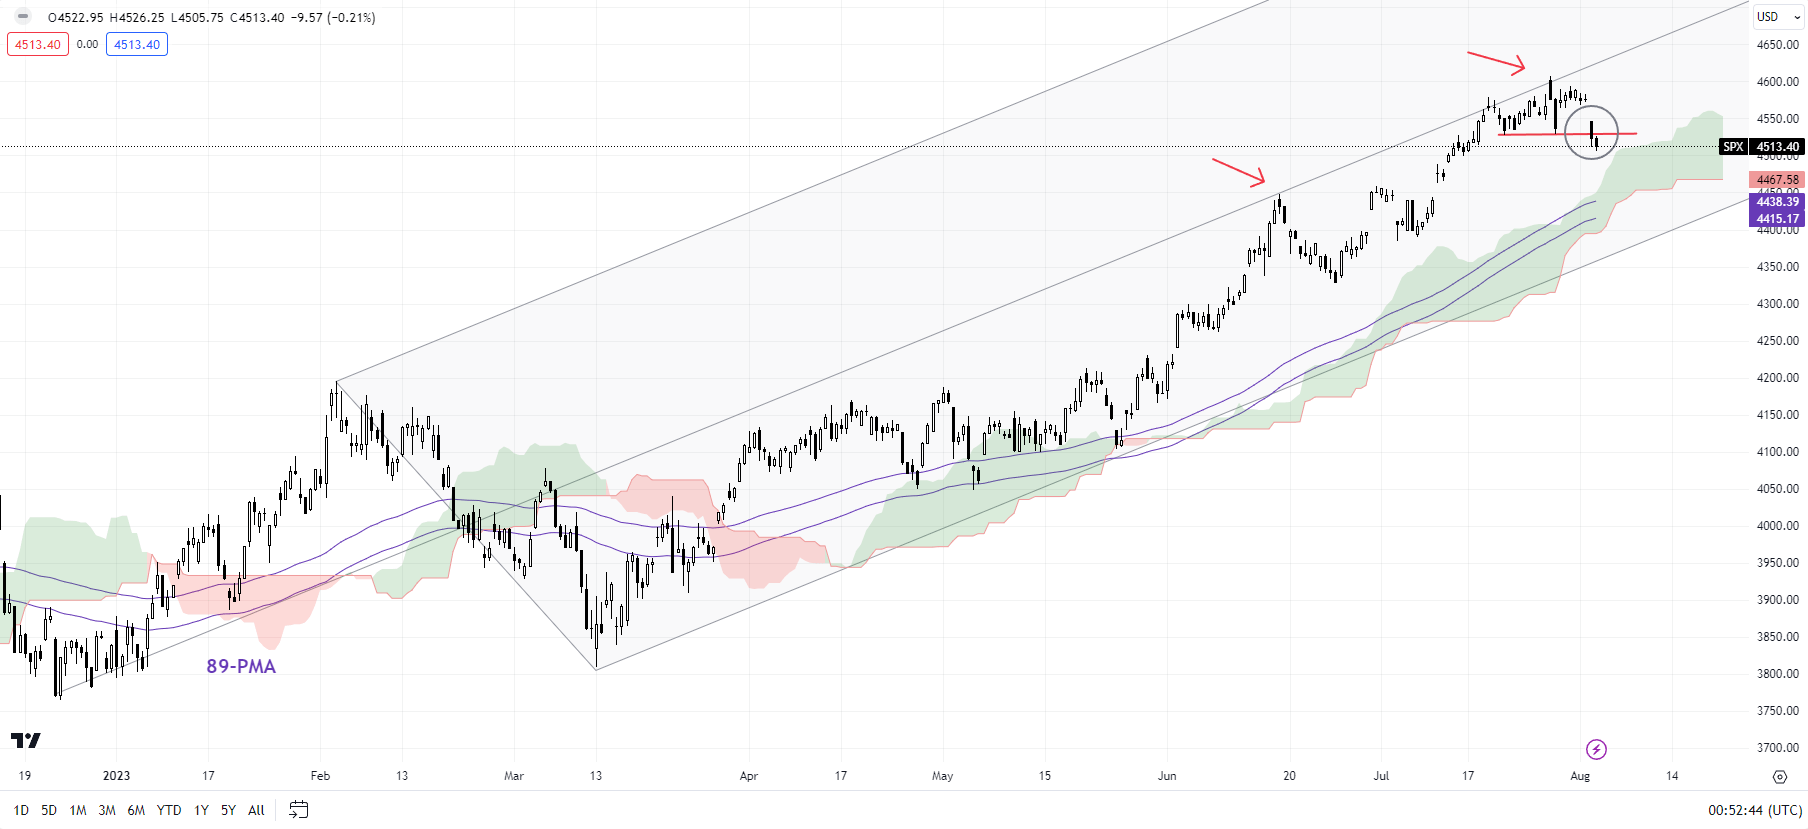
Chart Created by Manish Jaradi Using TradingView
S&P 500: Breaks below minor support
S&P 500 index’s fall below minor support at the late-July low of 4550 raises the odds of at least some consolidation/minor retreat in the short term – a riskhighlighted in late July. This follows a failure to rise past converged resistance on the upper edge of a rising pitchfork channel from the end of 2022 and the April 2022 high of 4637.
S&P 500 Monthly Chart
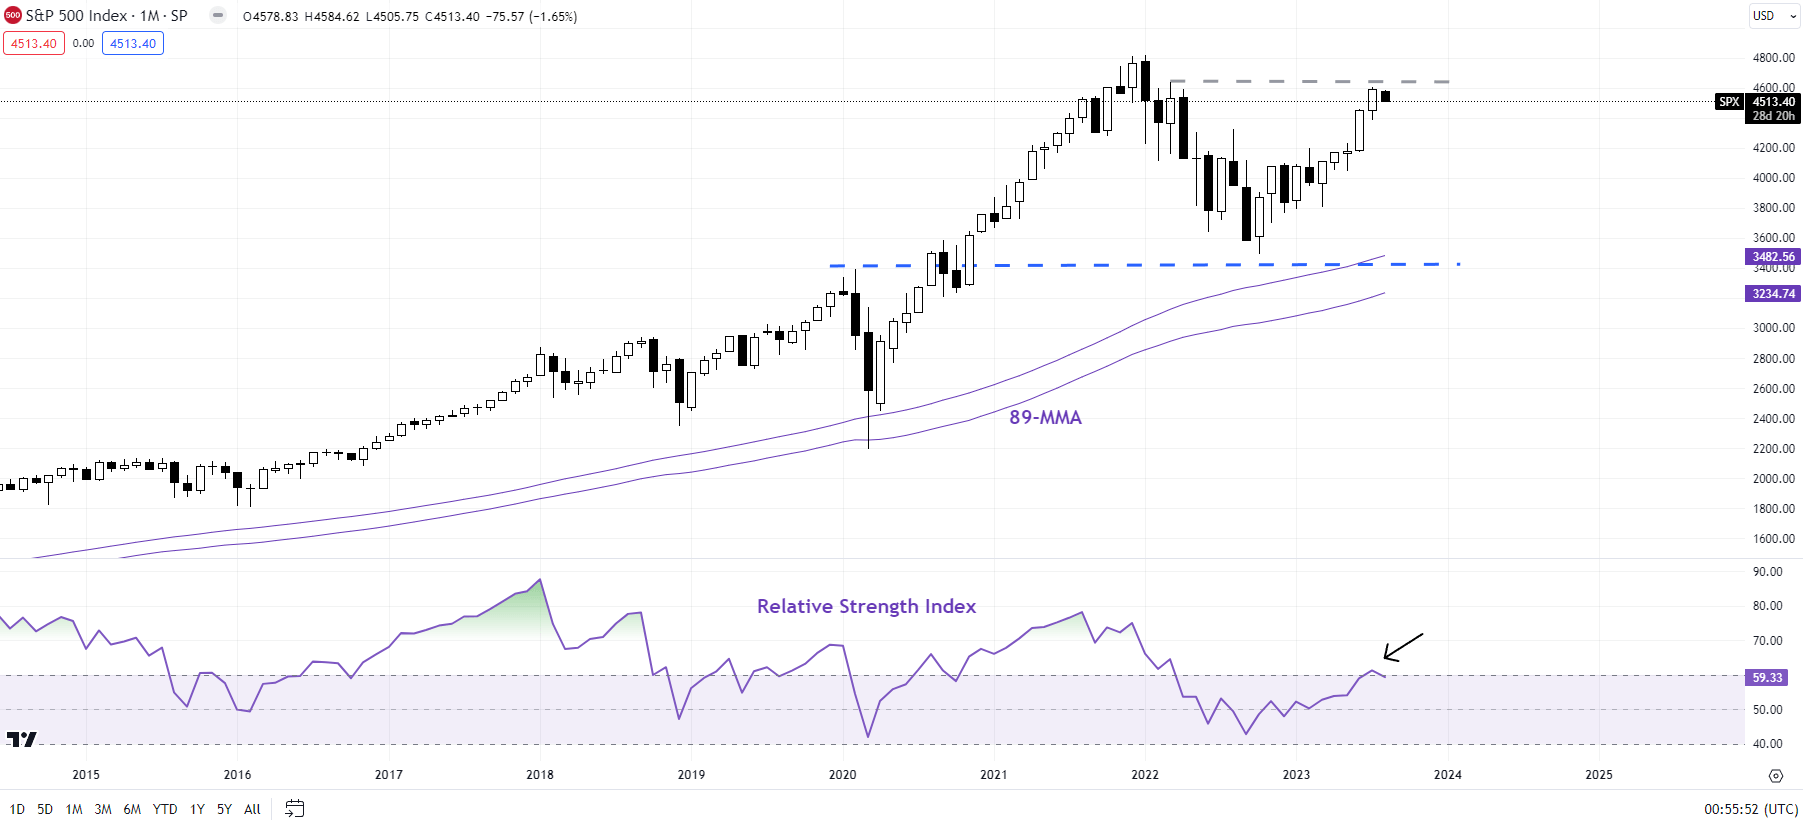
Chart Created by Manish Jaradi Using TradingView
The index could fall toward 4400-4415, including the 89-period moving average and the lower edge of the Ichimoku cloud on the 240-minute charts. That could restrict the downside for now given the still-strong momentum on the weekly charts. From a trend perspective, as highlighted in recent updates, the trend in the Nasdaq 100 index and the S&P 500 index’s trend remains up. However, the indices may need to consolidate before the next leg higher.

--- Written by Manish Jaradi, Strategist for DailyFX.com
--- Contact and follow Jaradi on Twitter: @JaradiManish


