
The S&P 500 and the Nasdaq 100 index’s break above key resistance confirms that the 2022-2023 downtrend has ended, raising the odds of a resumption of the long-term uptrend. While Nasdaq looks a bit tired, DJIA appears to be on the verge of a bullish break.
Nasdaq 100
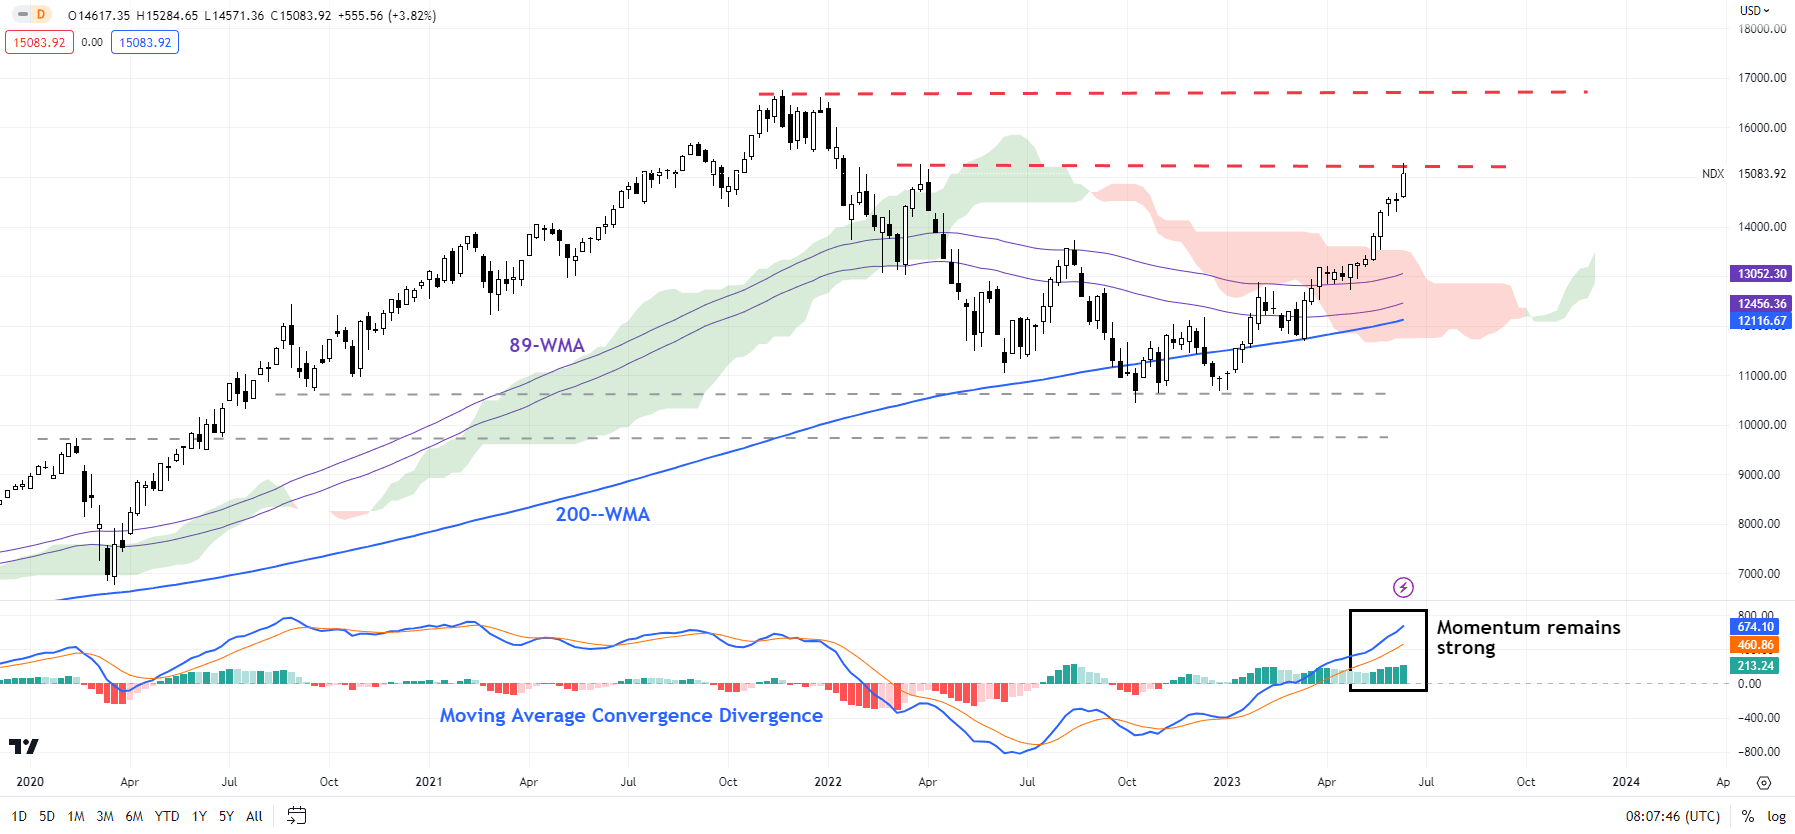
The Nasdaq 100 index in May rose above a stiff hurdle at the August 2022 high of 13720, confirming that the downward pressure has faded. This follows a rebound in late 2022-early 2023 from near-strong support on the 200-week moving average, and a break above the 89-week moving average in April – the shorter moving average served as strong resistance in the mid-2022 corrective rebound. The turnaround in the trend to bullish was first highlighted in early 2023 – see “S&P 500 and Nasdaq 100 Technical Outlook: Turning Bullish”, published January 28.
Having said that, the index is looking overbought/stretched. Market diversity as measured by fractal dimensions appears to be low. Fractal dimensions measure the distribution of diversity. When the measure hits the lower bound, typically 1.25-1.30 depending on the market, it indicates extremely low diversity as market participants bet in the same direction, raising the odds of a price reversal. For the Nasdaq 100 index, the 65-day fractal dimension fell below the threshold of 1.25, flashing a red flag.
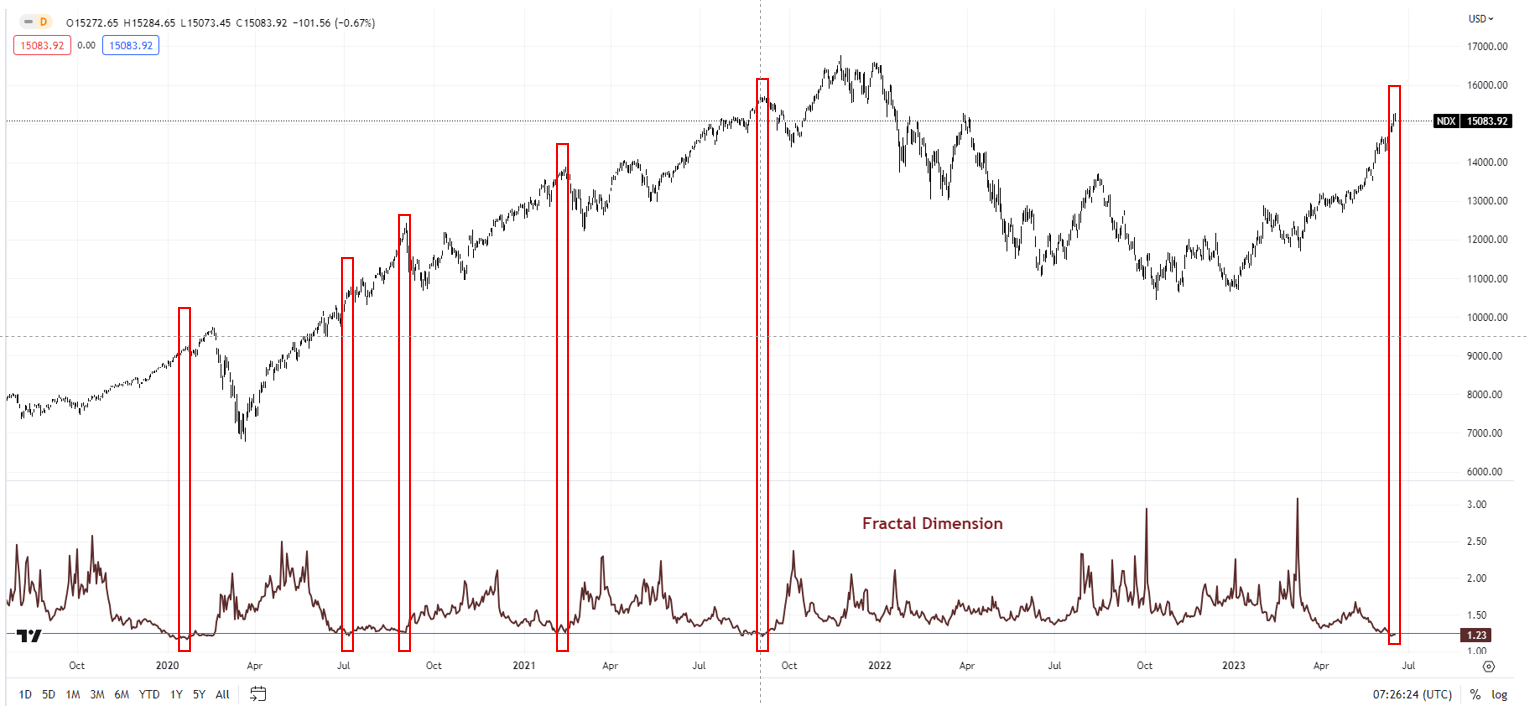
To be fair, this doesn’t imply an imminent price reversal. It means the bar for sustained gains before a correction is now much higher. However, unless there is a price confirmation, the path of least resistance remains up. Immediate support is at the early-June low of 14285 – a break below the support would confirm that the upward pressure had faded. On the upside, immediate resistance is at the April 2022 high of 15265, and a stronger barrier is at the 2021 record high of 16765.
S&P 500
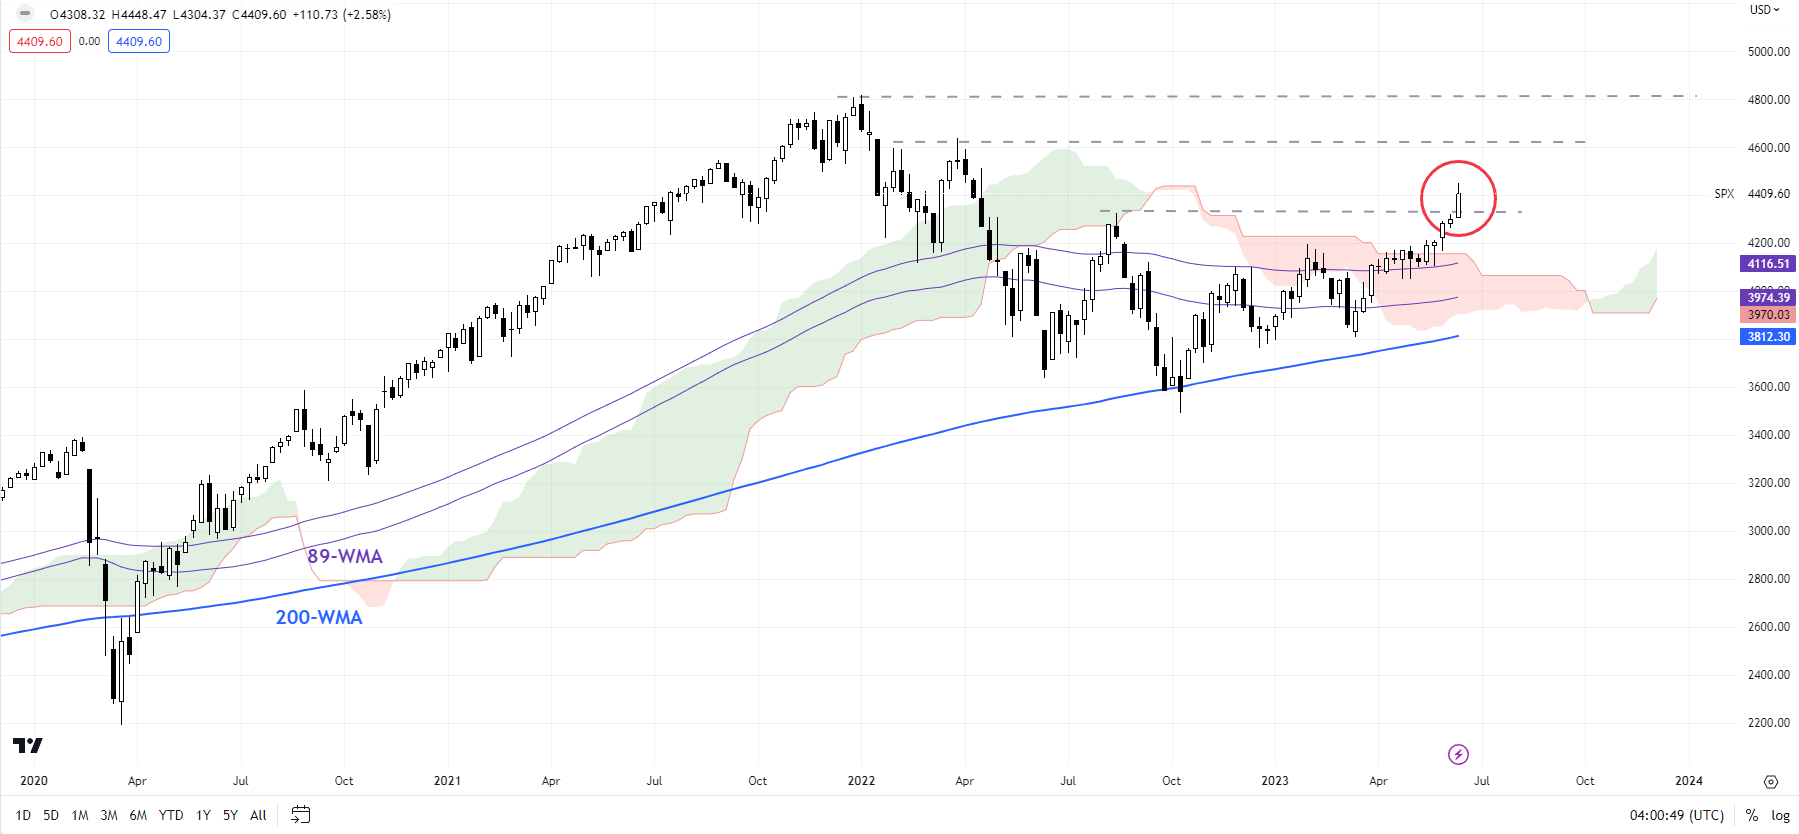
After months of sideway/choppy price action, the S&P 500 index earlier this month rose above the vital ceiling at the August high of 4325. Momentum on the weekly charts is picking up after the bullish break, pointing to further gains. The break has opened the gates toward the April 2022 high of 4637, potentially the 2022 record high of 4819.
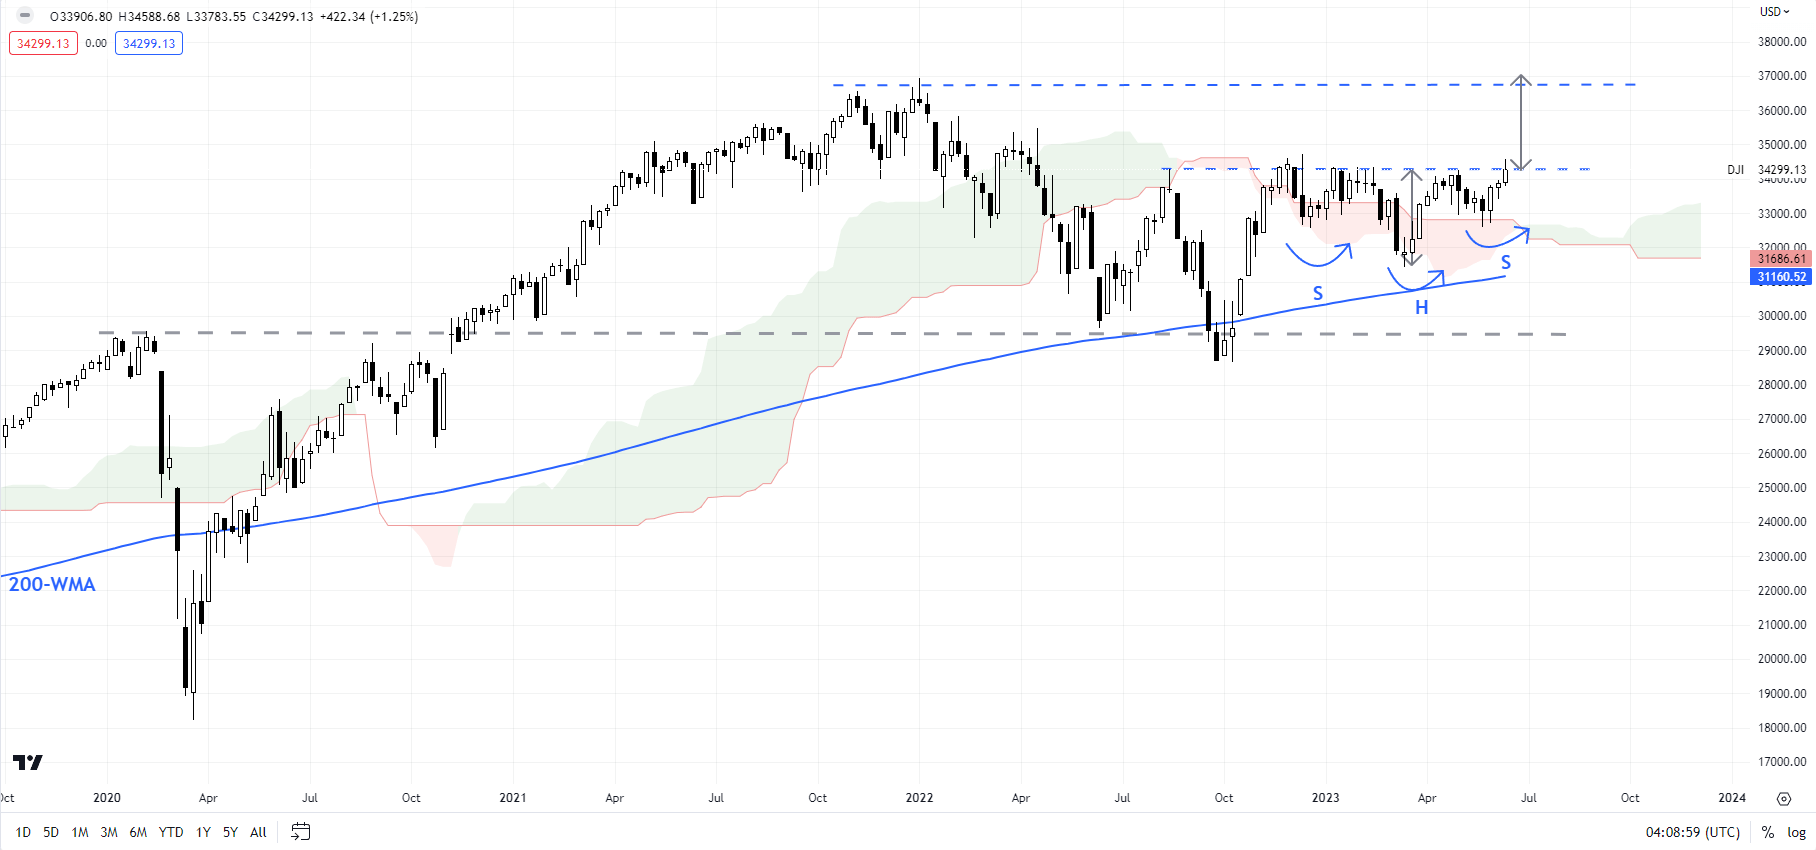
Dow Jones Industrial Average
The Dow Jones Industrial Average is attempting to break above a horizontal trendline from August at about 34280. A decisive break higher would trigger a reverse head & shoulders pattern (the left shoulder at the December low, the head at the March low, and the right shoulder could be the May low), opening the way toward the 2022 high of around 37000.