


Gold Forecast Bullish, Silver Forecast Neutral:
- Gold put in a massive breakout this week to trade up to fresh eight-month-highs. Silver continues to hold below a key spot of resistance around the 24.50 level.
- Gold made a statement this week with a strong bullish response after closing last week at resistance after its third consecutive week of gains and an 18.62% move from the October lows up to last week’s high.
- The analysis contained in article relies on price action and chart formations. To learn more about price action or chart patterns, check out our DailyFX Education section.

Gold prices surged last week after getting another lift following the release of December inflation data. US rates continue to drop and this has had impact on a number of markets like the US Dollar or stocks, and this has certainly shown in commodities, too.
Going back to last October, Gold was sitting on the precipice of long-term support with some pretty significant bearish potential. The support at-play was the 50% mark of the 2018-2020 bullish move, and this plotted right around the 1628 level. It had started to come into play in September following five consecutive months of weakness. Sellers continued to try to push the breakdown in October but were similarly stymied at that level; and when the door opened into November a strong bullish response took-over as prices broke out of a falling wedge formation that had built during the two months of posturing at support.
Since the November reversal, that strength has continued in a big way with another bullish candle in December and strong notes of continuation at the half-way point of January.
Gold Monthly Price Chart
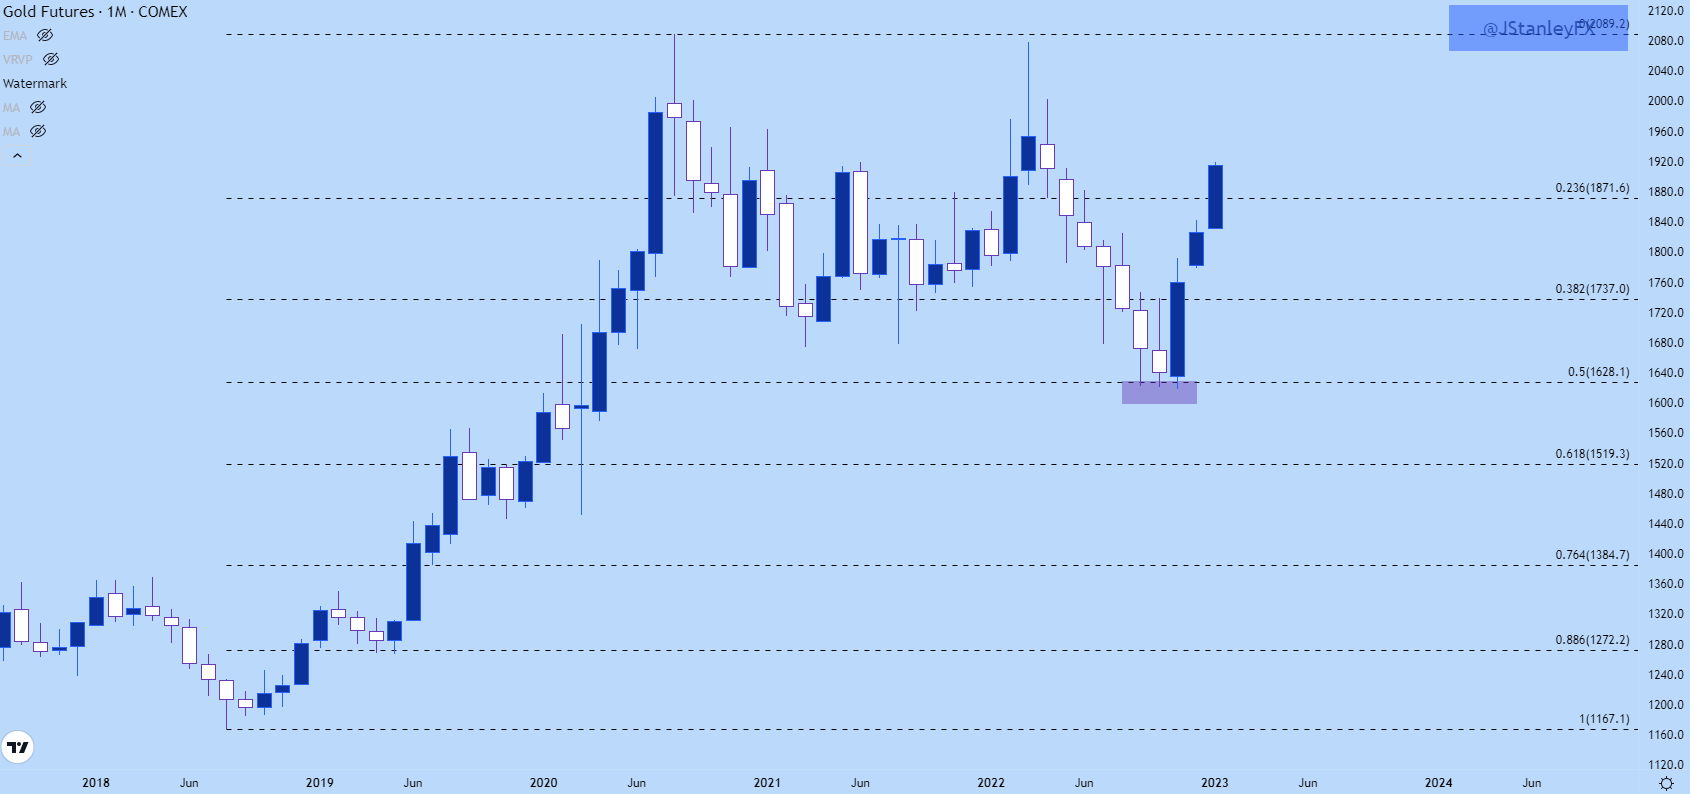
Chart prepared by James Stanley; Gold on Tradingview
Gold Shorter-Term
The sell-off in Gold last year was brutal, running from the February high of 2078, which came about $10 short of testing the all-time-high, all the way down to the 1628 level of support.
That 1628 support level, however, did not want to give way, as you can see from the three separate tests of that level, each of which failed to bring a daily close below that key price. This allowed for the build of the falling wedge formation which is often approached with the aim of bullish reversals, and that started to show in early-November as bulls started to make a move outside of the formation.
Along the way, the same Fibonacci retracement looked at above offered some guidance. There was resistance-turned-support at the 38.2% level of 1737, and then coming into last week, the 23.6% retracement from that same study had entered the picture, helping to hold the high into last week’s close.
Gold Daily Price Chart
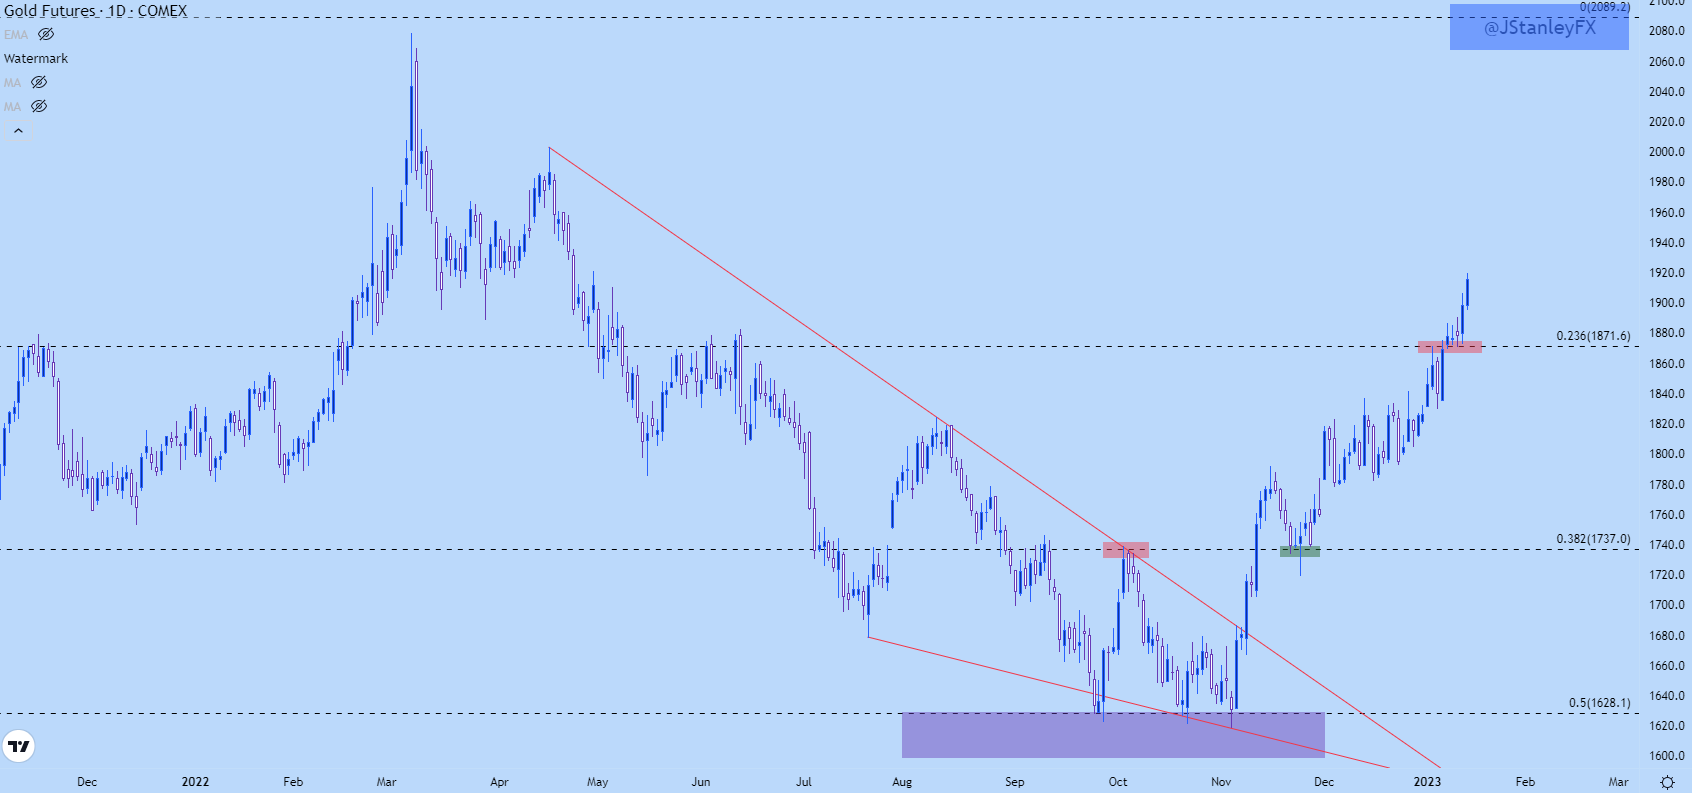
Chart prepared by James Stanley; Gold on Tradingview
Gold Even Shorter-Term
Going down to the four-hour chart, we can see a burgeoning breakout that’s still breaking out. This presents a clear challenge to both those looking to chase and those looking to fade, but one of the clear items is that the trend has been decisively bullish. For those looking at bearish setups in Gold, they’d probably want to wait that out for some greater indication of a near-term top being in-place. And given how important the 1871 level is, validated again last week after the prior validation of that Fibonacci study in October and November, a breach below that price would start to open the door for reversal themes.
For those that are bullish, however, entry protocol will be the challenge after this week showed a strong example of support at prior resistance, taken directly from that 23.6% Fibonacci retracement level at 1871, followed by an aggressive topside breakout into fresh eight-month-highs. Gold has already pushed up to the next area of resistance at 1923.7. This was the 2011 high and for almost nine full years, functioned as the all-time-high in Gold.
Bulls could move down to a shorter time frame to pick off possible support levels, and one such area exists around the 1900 psychological level. Outside of that, support potential will remain a challenge given how quickly this breakout has priced in.
Gold Four-Hour Price Chart
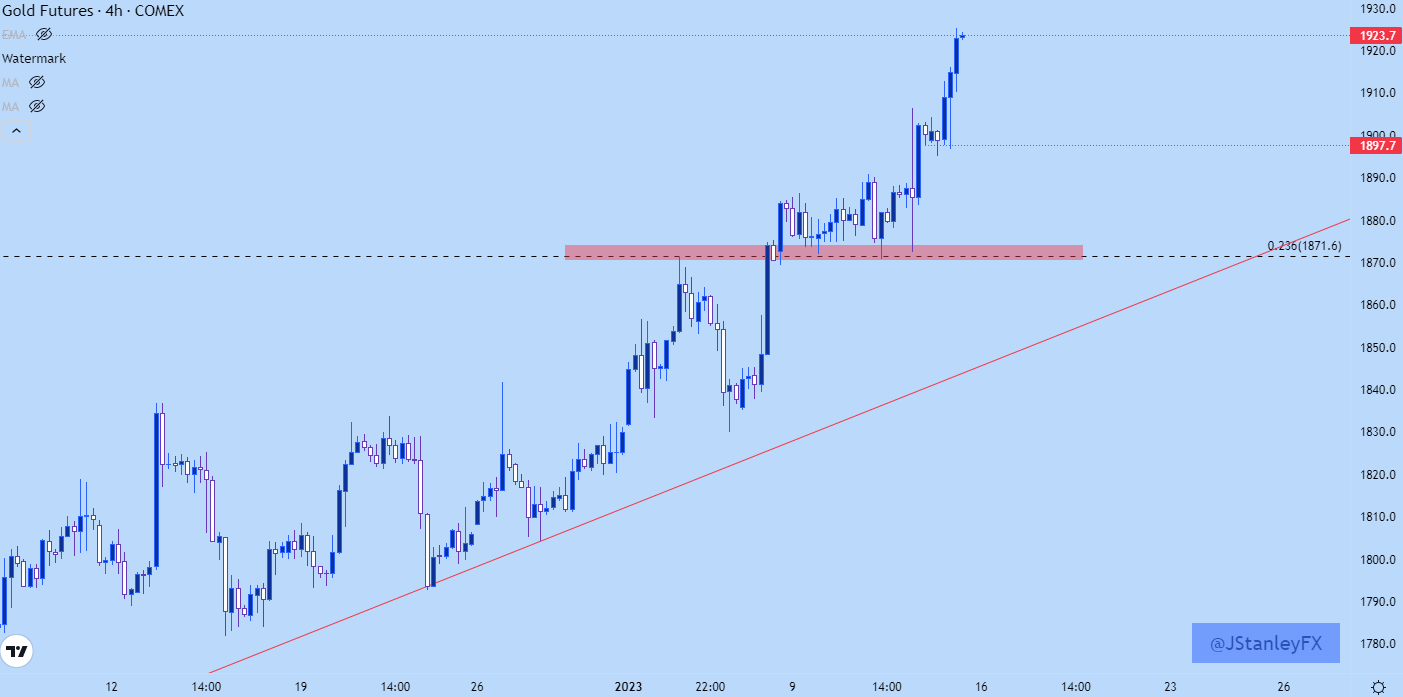
Chart prepared by James Stanley; Gold on Tradingview
Silver
Silver prices came into December with a full head of steam and for a while, were even outperforming Gold. That all changed when resistance showed up at 24.39 on December 13th, which was the morning of the November CPI release.
A month later that line-in-the-sand is still resistance and Silver hasn’t been able to trade over it yet, even with the surging move in Gold. A little-higher on the Silver chart is another area of prospective resistance, taken from a bearish trendline connecting 2021 and 2022 swing highs. For next week, that trendline projects to just over the $25 handle.
Silver Weekly Chart
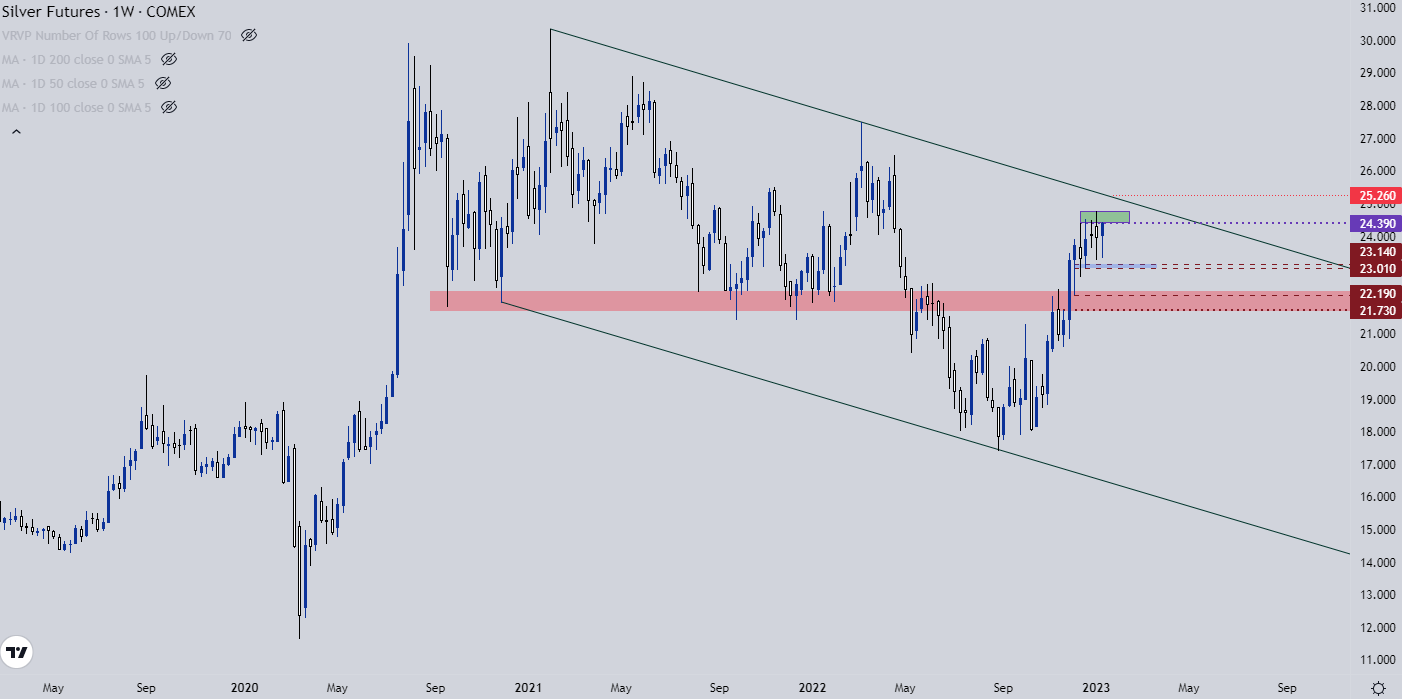
Chart prepared by James Stanley; Silver on Tradingview
From the weekly chart alone, this is something that I’ll generally bias towards bullishness. While that resistance has held as indicated by the upper wicks on four of the past five candles; last week’s bar shows a strong bullish response, taking on the appearance of a hammer. Hammers are usually sought out near market bottoms however and that’s not what we have here so it doesn’t quite qualify. But, the fact that bulls picked prices up later in the week after a push towards support is notable.
The larger quandary on the long side of silver is two-fold: First and foremost, as most silver traders will probably know, there’s been a penchant for silver to disappoint bulls, for a multitude of reasons. Case-in-point, silver is roughly 50% of its 2011 value, a high which hasn’t yet been re-tested, even though Gold has set a new high and is trading at that same 2011 level that set resistance back then. The second issue is one of trajectory – as a breakout from 24.39 will simply run into another area of potential resistance just a little bit-higher, around the 25 level which is confluent with the resistance side of a bearish trend channel, as shown below.
Notably, this bearish channel could be taking on the form of a bear flag so if/when price poses a breach through the trendline, there could be greater bullish potential. But traders would probably want to wait for that to take place first before planning on such.
Silver Monthly Chart
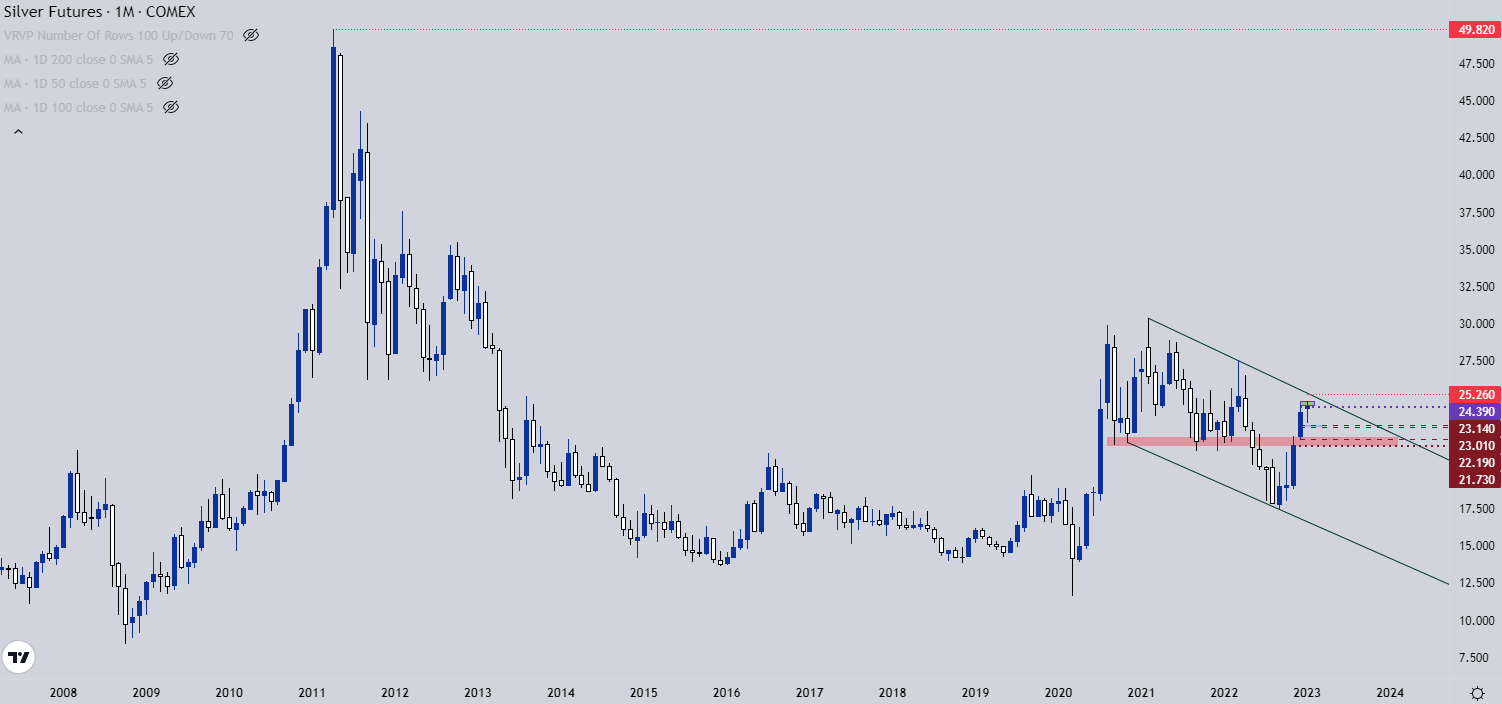
Chart prepared by James Stanley; Silver on Tradingview
--- Written by James Stanley
Contact and follow James on Twitter: @JStanleyFX


