


Gold, XAU/USD – Price Action:
- XAU/USD has fallen below key support.
- Hawkish central bank rhetoric and improving risk sentiment weigh on gold.
- To what extent XAU/USD could fall?

Gold’s fall below key support on Thursday confirms that the multi-week upward pressure has faded as hawkish central bank rhetoric and improving broader risk sentiment diminish the safe-haven appeal of the yellow metal.
After holding for weeks above the support, XAU/USD has fallen below 1930, including the end-May low, the 89-day moving average, and the lower edge of the Ichimoku cloud – a risk highlighted in Thursday’s update. See “Gold Price Action: XAU/USD Vulnerable After Powell’s Remarks,” published June 22.
XAU/USD 240-minute Chart
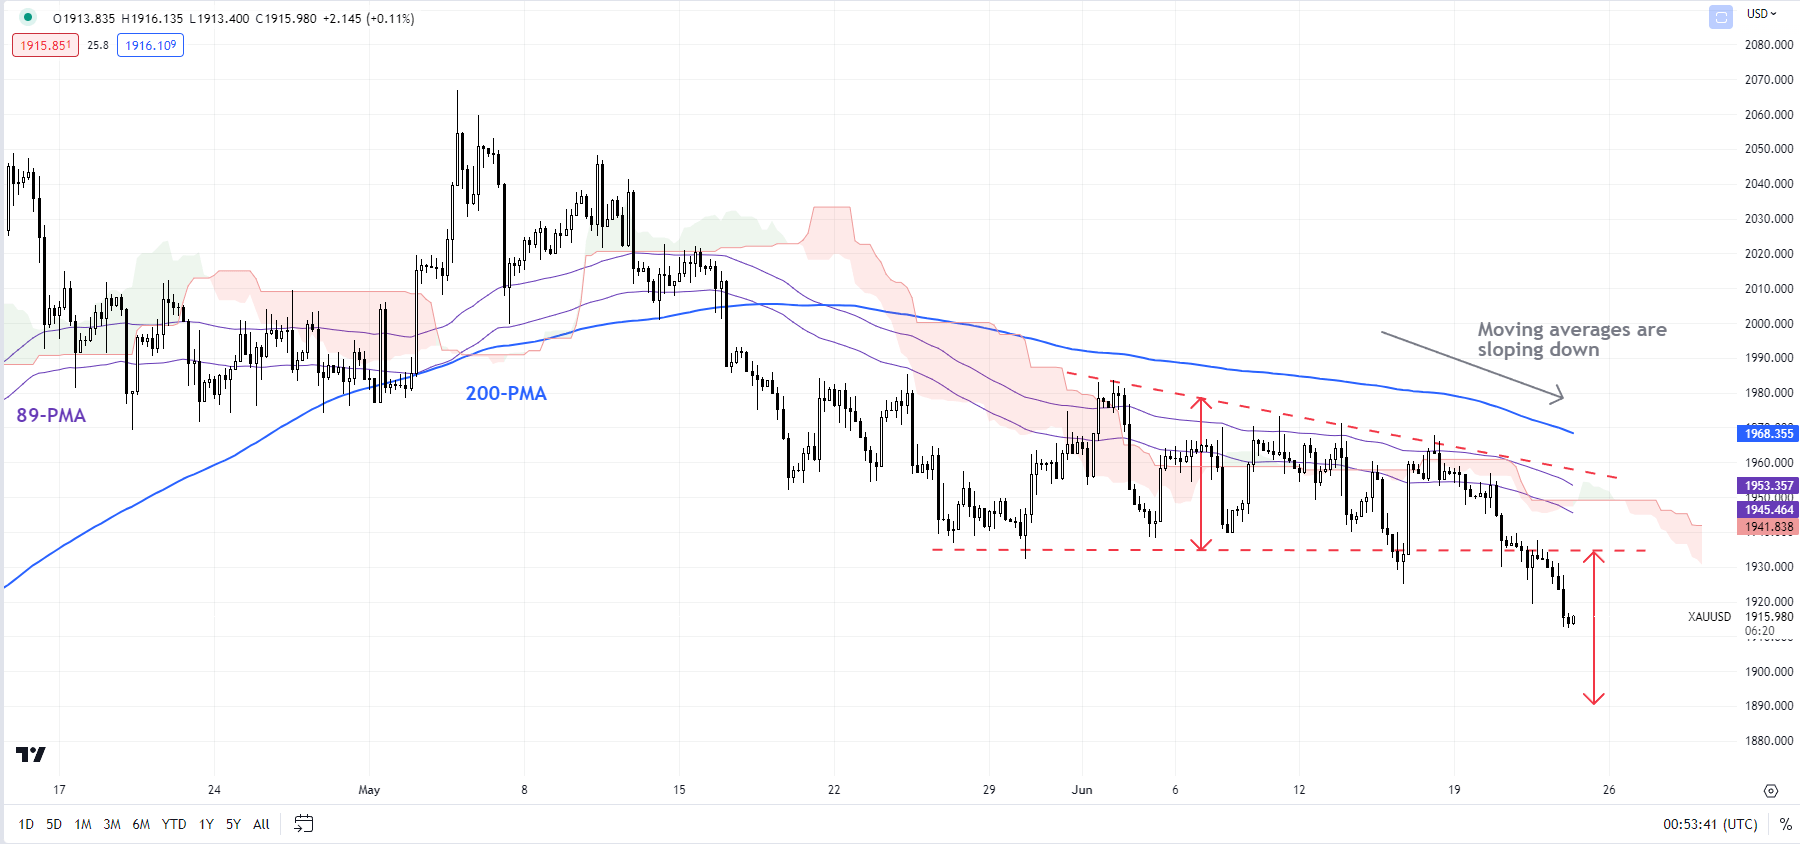
Chart Created by Manish Jaradi Using TradingView
Two potential price objectives come up from the recent price action. On the hourly chart, the break below a horizontal trendline from the end of May has triggered a minor descending triangle, with a price objective of around 1890.
On the daily charts, the rebound at the beginning of the month was feeble, retracing only 38.2% of the May decline. A measured price objective of the May downswing, points to a fall toward the 200-day moving average (now at about 1852).
XAU/USD Daily Chart
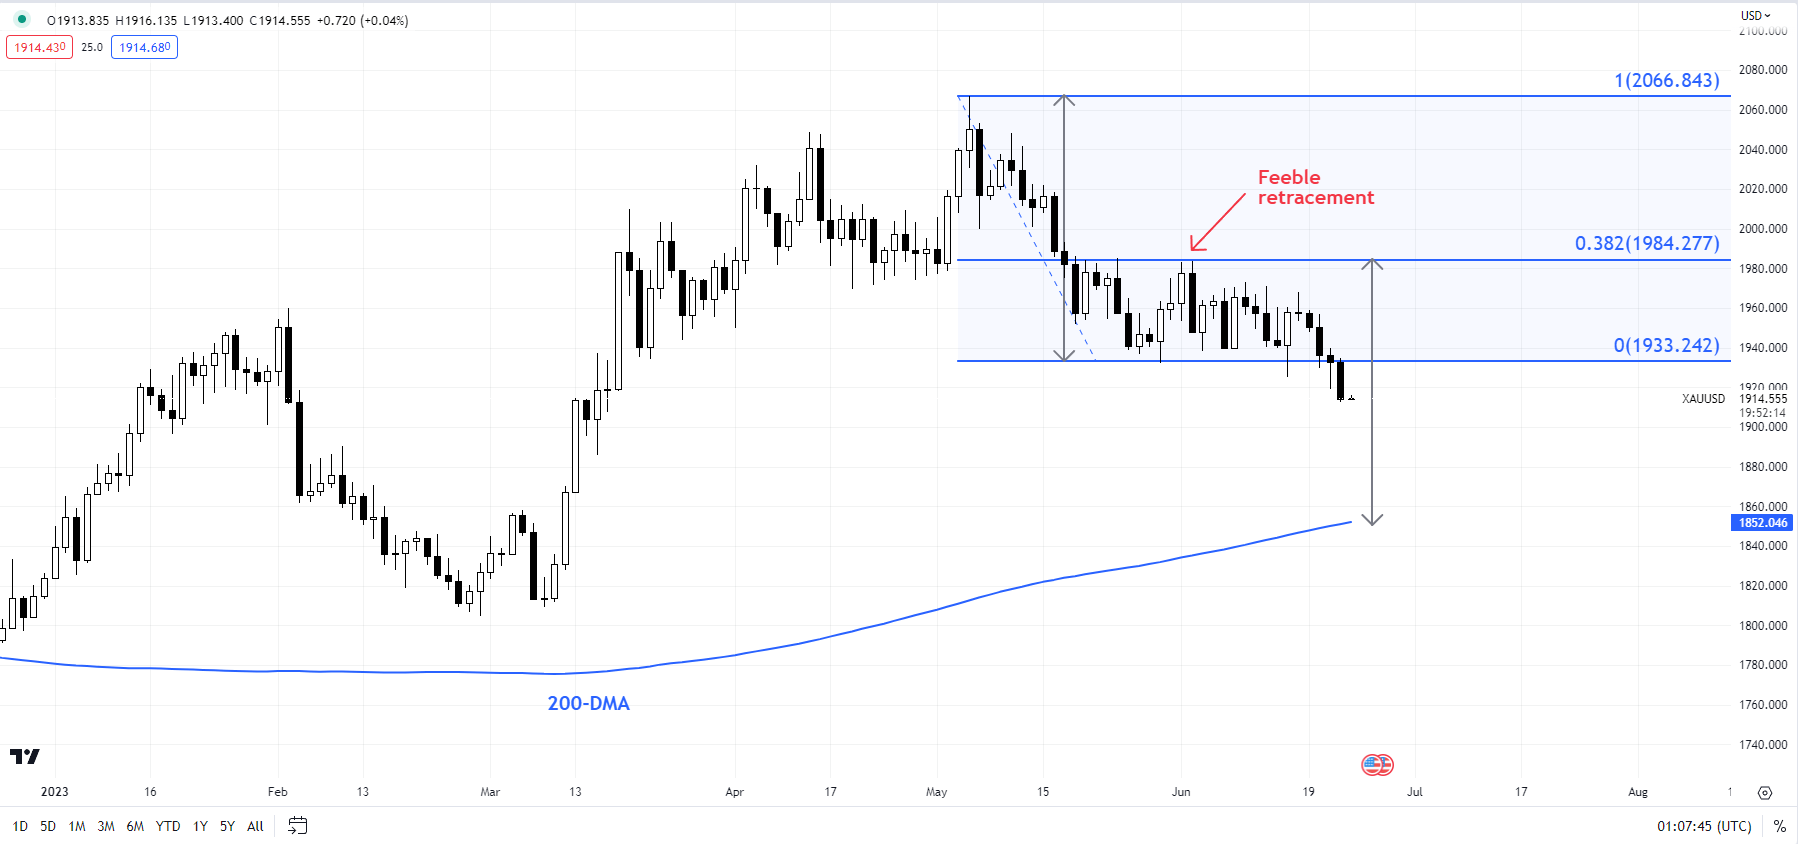
Chart Created by Manish Jaradi Using TradingView
Powell reiterated the central bank’s hawkish stance saying more rate hikes may be needed, adding that interest rates would move at a “careful pace” from here. “We’re at least close to where we think our destination is…”, said Powell at a hearing before the Senate Banking Committee on Thursday.
XAU/USD Daily Chart
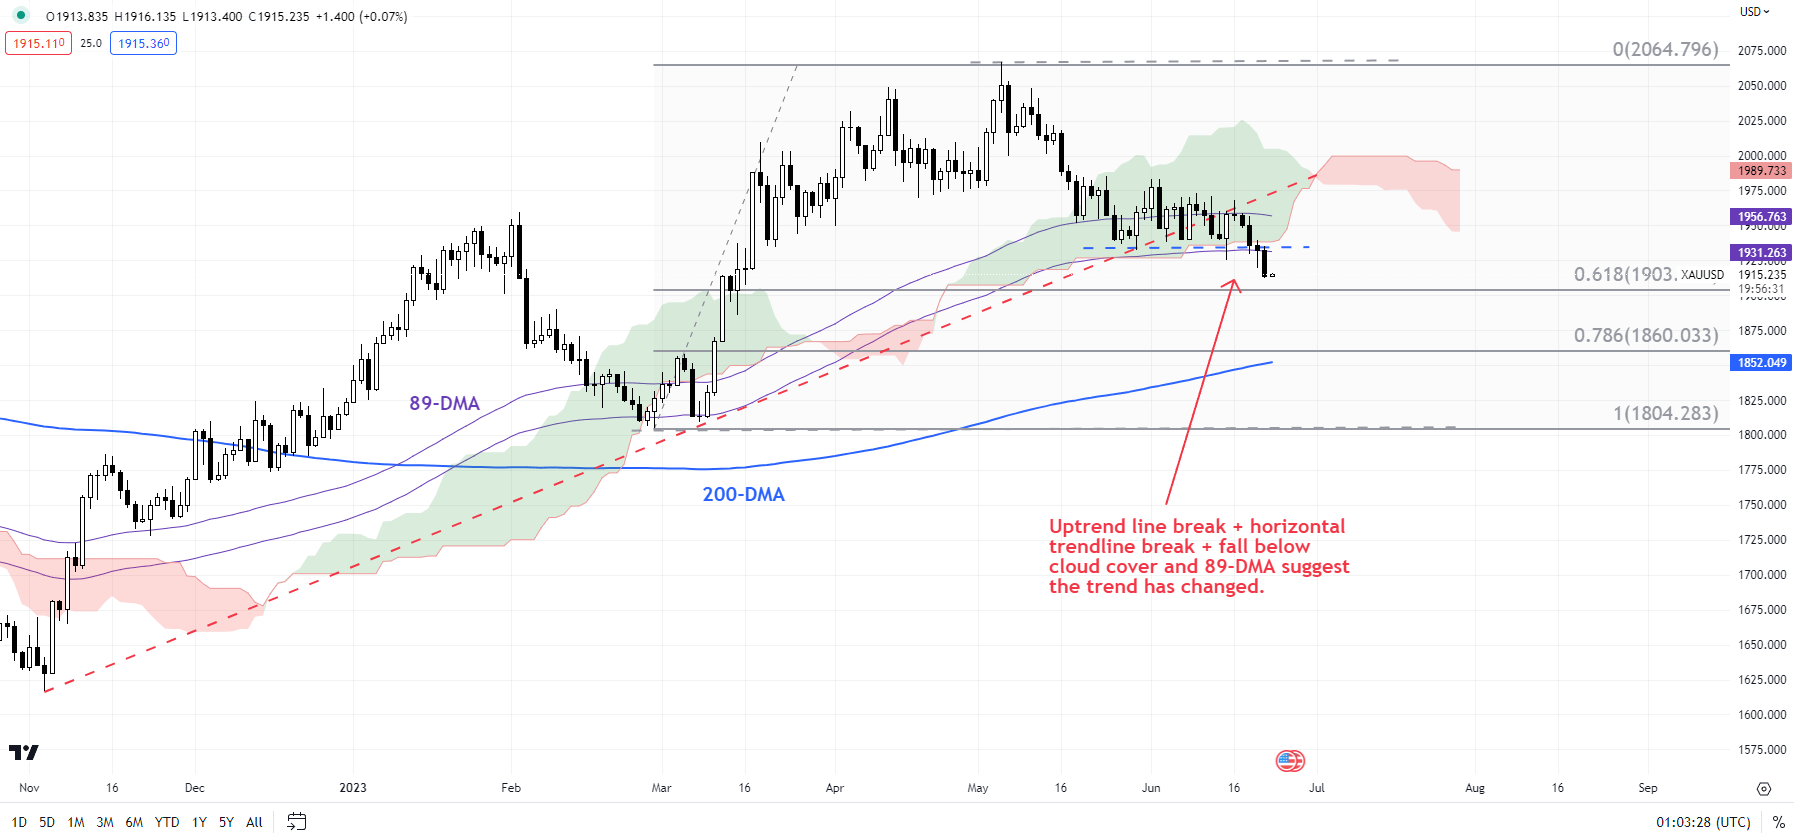
Chart Created by Manish Jaradi Using TradingView
Powell added a bit more colour on the June skip, saying “the point” of holding rates steady was precisely to slow the speed with which the Fed was raising borrowing costs. Separately, Fed Governor Michelle Bowman said on Thursday that further rate increases were needed, indicating at least two more hikes are warranted. Moreover, the Bank of England surprisingly raised interest rates by 50 basis points on Thursday (Vs 25 basis points expected), suggesting that global central banks’ battle against inflation is far from over.
XAU/USD Daily Chart
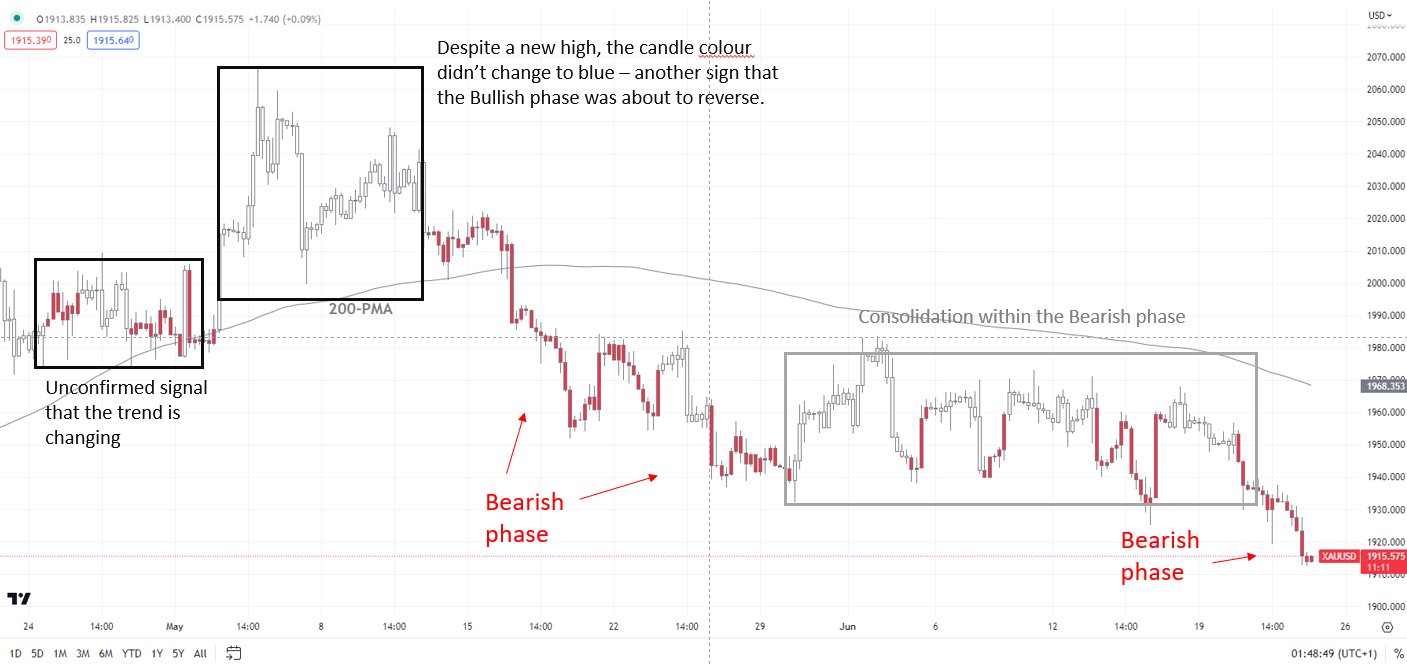
Chart Created by Manish Jaradi Using TradingView; Refer to notes at the bottom of the page.
The trend on intraday charts continues to remain down, as the colour-coded 240-minute candlestick charts show. Importantly, XAU/USD has broken below the Ichimoku cloud cover on the daily chart and the 89-day moving average for the first time since the end of 2022. Also, this coincides with a break below an uptrend line from November, confirming that the upward pressure has eased for now.
A large part of the current weakness seems to be a spillover effect of what’s happening on higher timeframe charts, as highlighted in recent months. See “Gold Could Find It Tough to Crack $2000”,published March 28, and “Gold Weekly Forecast: Is it Time to Turn Cautious on XAU/USD?” published April 16. Subsequent updates can be found here:April 24,May 10,May 17, May 31, and June 8.
Note: The above colour-coded chart(s) is(are) based on trending/momentum indicators to minimize subjective biases in trend identification. It is an attempt to segregate bullish Vs bearish phases, and consolidation within a trend Vs reversal of a trend. Blue candles represent a Bullish phase. Red candles represent a Bearish phase. Grey candles serve as Consolidation phases (within a Bullish or a Bearish phase), but sometimes they tend to form at the end of a trend. Candle colors are not predictive – they merely state what the current trend is. Indeed, the candle color can change in the next bar. False patterns can occur around the 200-period moving average, or around a support/resistance and/or in sideways/choppy market. The author does not guarantee the accuracy of the information. Past performance is not indicative of future performance. Users of the information do so at their own risk.
Trade Smarter - Sign up for the DailyFX Newsletter
Receive timely and compelling market commentary from the DailyFX team
--- Written by Manish Jaradi, Strategist for DailyFX.com
--- Contact and follow Jaradi on Twitter: @JaradiManish


