


Gold Price Analysis and Charts
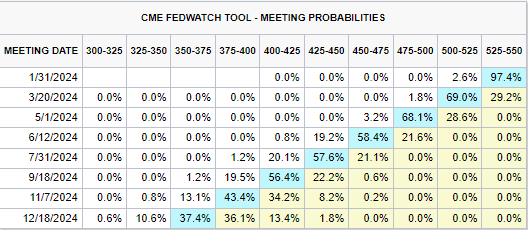
- CME rate probabilities are now showing a potential seven rate cuts next year.
- Gold remains stuck below resistance for now.
Download our Complimentary Q1 2024 Gold Technical and Fundamental Forecast

Most Read: Gold Price weekly Forecast: Gold Rallies on US Rates, Geopolitical Worries
The latest look at the CME FedWatch Tool shows market expectations of seven, quarter-point interest rate cuts next year, starting at the March 20th meeting. While the December cut is looking like a coin toss, the fact that markets continue to price an aggressive loosening of US monetary policy, despite various Fed members pushing back against these forecasts, suggests that markets feel that the Fed is behind the curve.
For all economic data releases and events see the DailyFX Economic Calendar
The ongoing geopolitical tensions in and around the Red Sea and the war in Ukraine continue to weigh on risk sentiment. While US equity markets continue to test multi-year highs and are being held up by the Magnificent Seven, in Europe the FTSE 100 and the DAX 40 are both under short-term pressure. US earnings season is now upon us and any misses by the likes of Microsoft, Apple, and Nvidia for example, may send the currently buoyant US indices space weaken.
The technical outlook for gold remains positive despite today’s underperformance. Support from the 50-day simple moving average at $2,020/oz. and a prior swing high at $2,009/oz. should hold any further sell-off, at least in the short term. A push higher by the precious metal will see resistance at $2,043/oz. ahead of $2,070/oz.

Gold Daily Price Chart
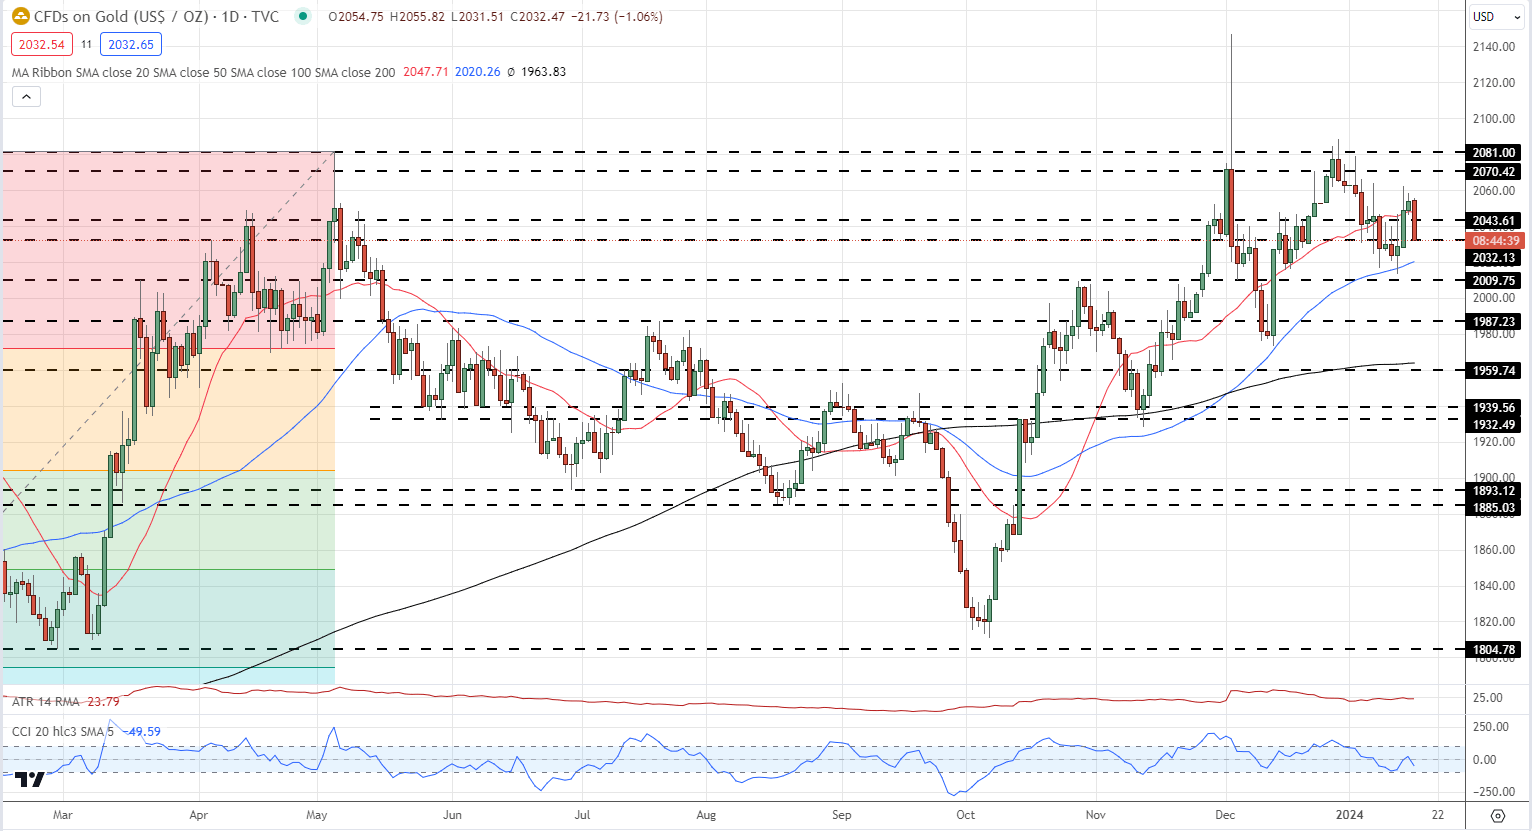
Chart via TradingView
Retail trader data shows 56.23% of traders are net-long with the ratio of traders long to short at 1.28 to 1.The number of traders net-long is 1.26% higher than yesterday and 0.89% higher than last week, while the number of traders net-short is 6.14% higher than yesterday and 11.66% higher than last week.
We typically take a contrarian view to crowd sentiment, and the fact traders are net-long suggests Gold prices may continue to fall.
See how changes in IG Retail Trader data can affect sentiment and price action.
| Change in | Longs | Shorts | OI |
| Daily | -10% | 11% | -2% |
| Weekly | -4% | 12% | 2% |
What is your view on Gold – bullish or bearish?? You can let us know via the form at the end of this piece or you can contact the author via Twitter @nickcawley1.


