


Gold Price Talking Points
The price of gold extends the rebound from the yearly low ($1615) as the Relative Strength Index (RSI) climbs above 30 to offer a textbook buy signal, but the former-support zone around the July low ($1681) may act as resistance as bullion appears to be tracking the negative slope in the 50-Day SMA ($1726).
Gold Price Rebound Eyes Former Support Zone
The price of gold appears to have reversed ahead of the April 2020 low ($1568) amid the recent pullback in US Treasury yields, and the precious metal may continue to retrace the decline from the monthly high ($1735) as the RSI moves away from oversold territory.
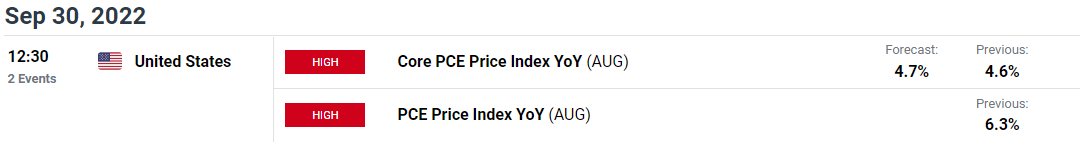
As a result, the price of gold may stage another attempt to test the moving average as the bearish momentum abates, but the update to the US Personal Consumption Expenditure (PCE) may drag on the precious metal as the core rate, the Federal Reserve’s preferred gauge for inflation, is expected to increase to 4.7% in August from 4.6% per annum the month prior.
Evidence of persistent inflation may force the Federal Open Market Committee (FOMC) to maintain its approach in combating inflation as the central bank pursues a restrictive policy, and it remains to be seen if Chairman Jerome Powell and Co. will deliver another 75bp rate hike at the next rate decision on November 2 as the Summary of Economic Projections (SEP) show a steeper path for US interest rates.
Until then, developments coming out of the US may sway the price of gold as the FOMC retains a hawkish forward guidance for monetary policy, and the rising interest rate environment across advanced economies may continue to sap the appeal of bullion as the Fed appears to be on track to carry its hiking-cycle into 2023.
With that said, the move above 30 in the Relative Strength Index (RSI) raises the scope for a larger rebound in the price of gold as the oscillator moves away from oversold territory, but the former-support zone around the July low ($1681) may act as resistance as bullion seems to be tracking the negative slope in the 50-Day SMA ($1726).
Gold Price Daily Chart
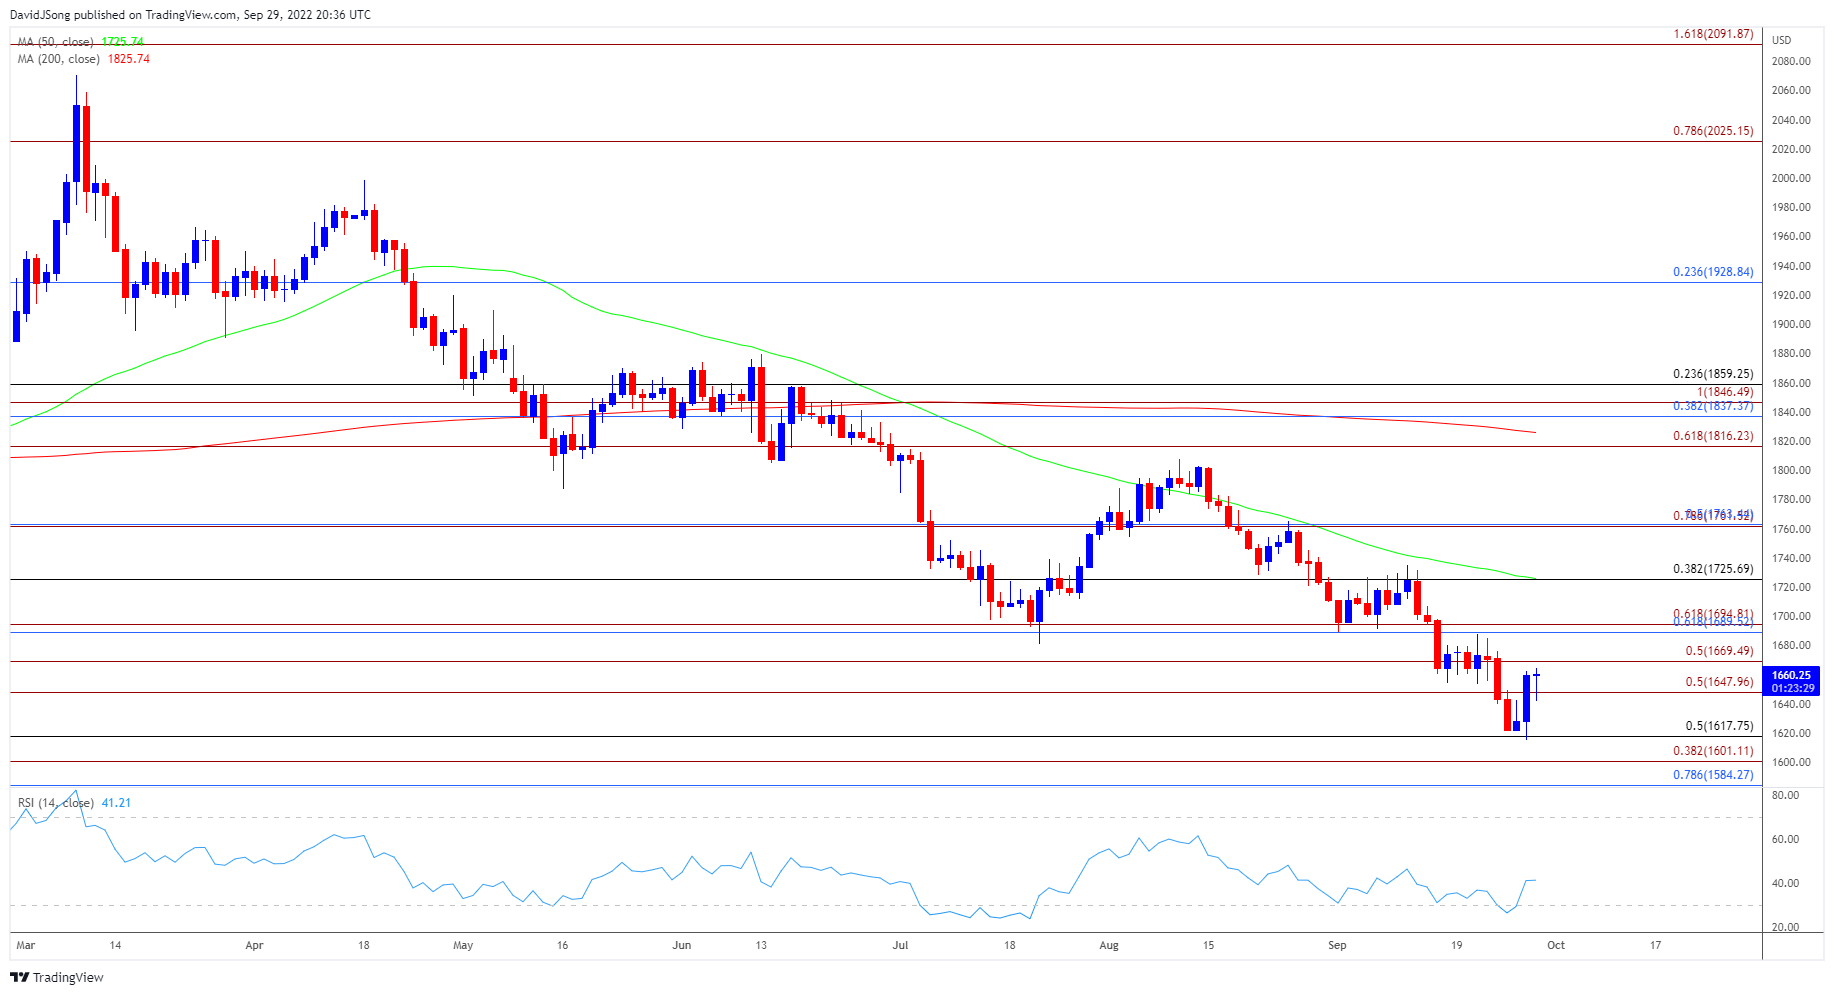
Source: Trading View
- The price of gold bounces back from a fresh yearly low ($1615) following the failed attempts to push below the Fibonacci overlap around $1601 (38.2% expansion) to $1618 (50% retracement), with a move above the $1670 (50% expansion) region bringing the $1690 (61.8% retracement) to $1695 (61.8% expansion) area back on the radar.
- Next area of interest comes in around $1726 (38.2% retracement), which lines up with the 50-Day SMA ($1726), but the price of gold may continue to track the negative slope in the moving average if the former-support zone around the July low ($1681) acts as resistance.
- Failure to hold above the $1648 (50% expansion) area may push the price of gold back towards the overlap around $1601 (38.2% expansion) to $1618 (50% retracement), with a break/close below the $1584 (78.6% retracement) region opening up the April 2020 low ($1568).
Trading Strategies and Risk Management
Becoming a Better Trader
Recommended by David Song
--- Written by David Song, Currency Strategist
Follow me on Twitter at @DavidJSong


