

USD/JPY AND GBP/USD OUTLOOK:
- USD/JPY deepens its decline as U.S. Treasury rates extend their downward correction
- Softer-than-expected U.S. CPI and PPI data weigh on bond yields
- Meanwhile, GBP/USD blasts higher, rising to its best levels since April 2022

Most Read: Gold Finds Spark in Weak US Inflation Data, EUR/USD Blasts Off to New 2023 Peak
USD/JPY deepened losses on Thursday, dragged down by falling U.S. Treasury rates. Since Monday, the 10-year yield has fallen nearly 30 basis points to the edge of 3.8%, erasing all gains from the previous week, with the slump accelerating over the past couple of sessions following weaker-than-expected U.S. consumer costs and wholesale inflation.
While market expectations remain in a state of flux, rapidly softening price pressures in the economy could nudge the Fed to end its tightening campaign sooner than projected. This means that the fully discounted quarter-point hike for the July FOMC meeting could be the last of the cycle before a long pause, a situation that could undermine the U.S. dollar in the FX space.
Turning to price action analysis, USD/JPY has fallen sharply in recent days after breaking below its 50-day simple moving average and the trendline extended from the March lows. Following this pullback, the pair has reached an important support area: the 38.2% Fibonacci retracement of the Jan-Jun rally. If this floor taken out, we could see a move towards the 200-day simple moving average, followed by 134.00.
On the flip side, if USD/JPY establishes a base off current levels and resumes its ascent, initial resistance appears at 139.25 and 140.00 thereafter. Clearance of these two technical barriers could spark follow-through buying and restore bullish impetus, setting the stage for a rally toward the psychological 141.00 mark.
USD/JPY TECHNICAL CHART
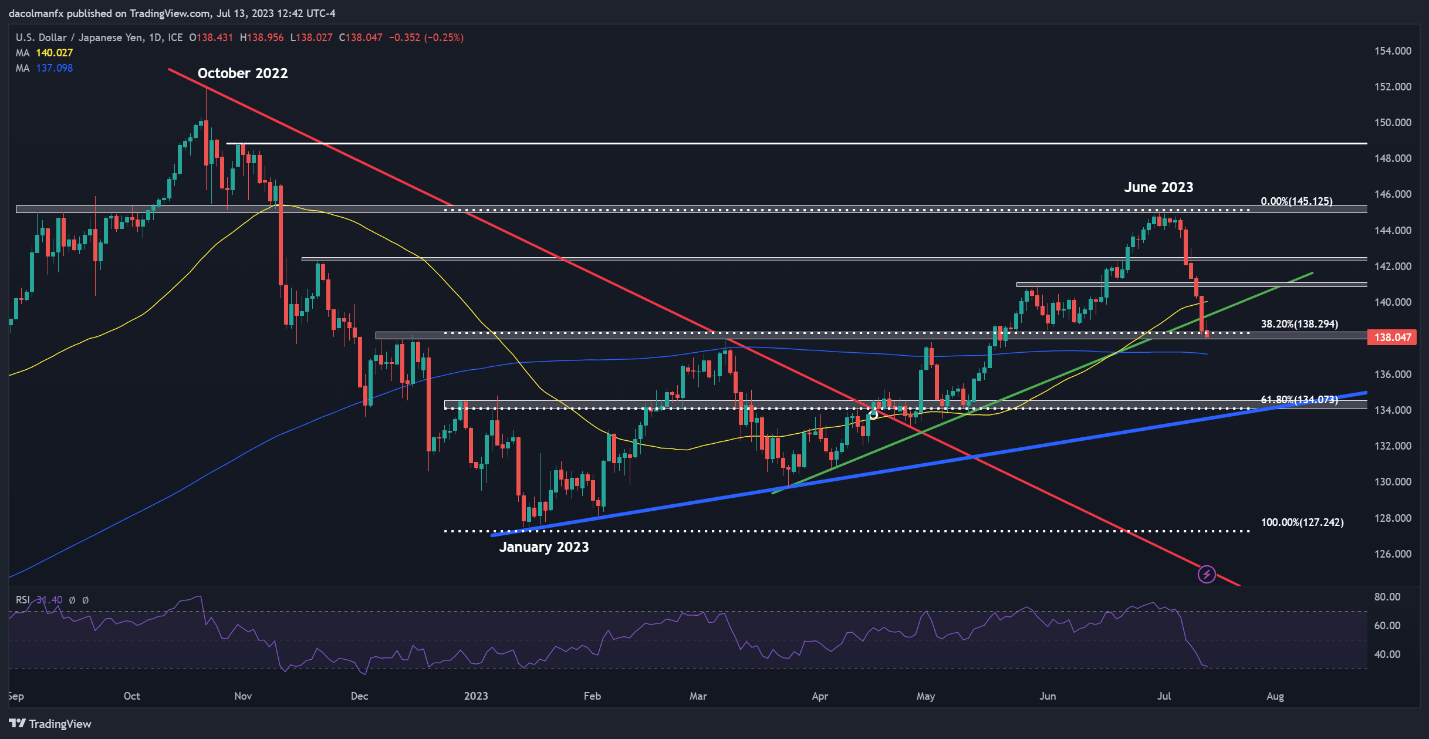
USD/JPY Chart Created Using TradingView
GBP/USD TECHNICAL ANALYSIS
GBP/USD breached an important technical resistance at 1.3000 on Thursday, reaching its best levels since April 2022 and easily surpassing the 1.3100 handle. After this solid advance, the pair is approaching a key ceiling near 1.3150, as shown on the daily chart below. Buyers may struggle to get over this hurdle given stretched markets and overbought conditions, but a bullish breakout remains possible and, if confirmed, could pave the way for a move towards 1.3290.
In contrast, if upward momentum begins to fade and prices reverse lower, initial support rests at the psychological 1.3000 mark, but further losses could be in store on a push below this zone, with the next downside target located at 1.2840, followed by 1.2680.

GBP/USD TECHNICAL CHART
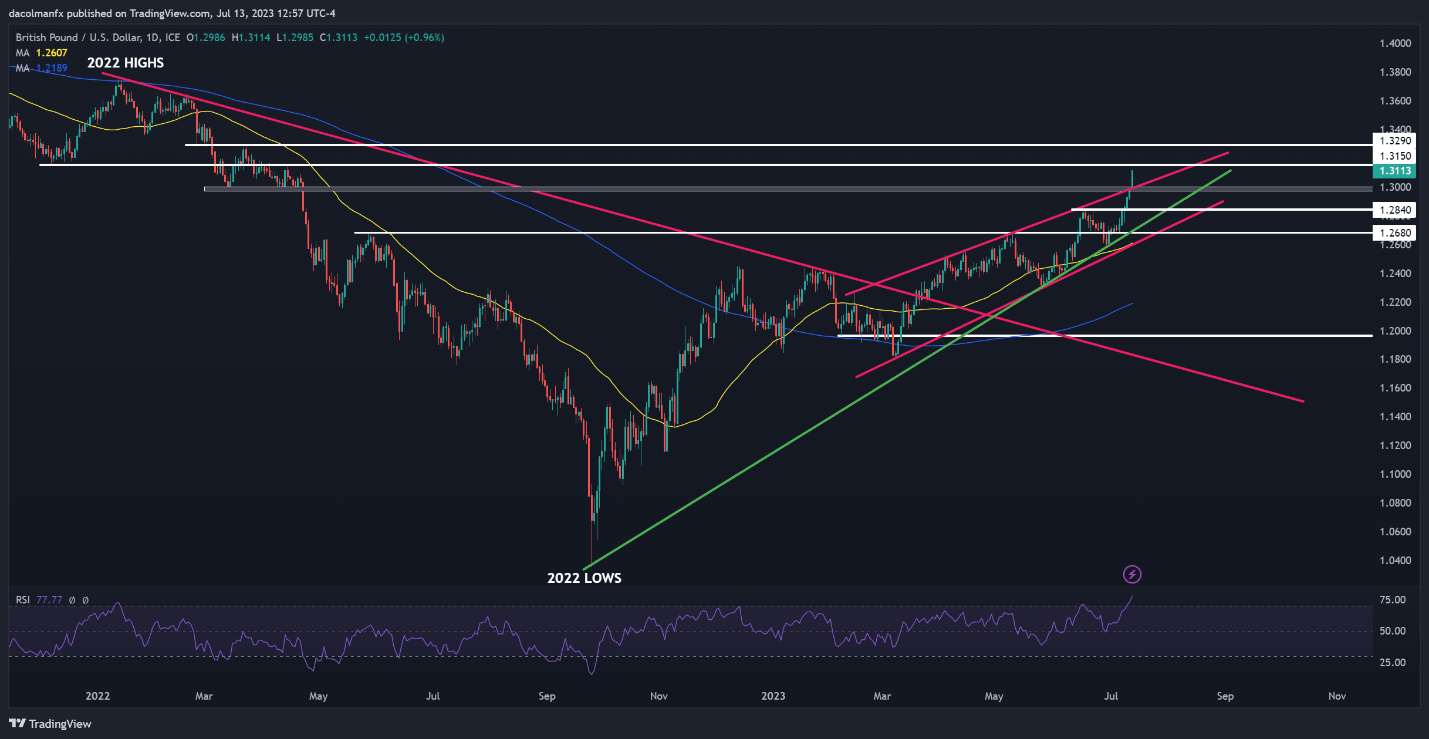
GBP/USD Chart Prepared Using TradingView