GOLD AND EUR/USD OUTLOOK:
- Gold prices clear technical resistance and rally above $1,950 following softer-than-expected U.S. inflation data
- The U.S. dollar sinks as interest rate expectations shift in a less hawkish direction
- Meanwhile, EUR/USD soars and moves past the 1.1100 handle, reaching its best level since March 2022

Most Read: Fed Making Headway as US Inflation Slows, S&P 500 Edges Higher
Gold prices skyrocketed and gained more than 1.3% on Wednesday, bolstered by U.S. dollar weakness and sinking U.S. Treasury yields following softer-than-expected U.S. inflation numbers.
According to the U.S. Bureau of Labor Statistics, annual headline CPI came in at 3.0% in June, one-tenth of a percent below consensus estimates and a big step down from the 4.0% rate recorded in May. The core gauge also surprised to the downside, clocking in at 4.8% versus a forecast of 5.0%, a sign that underlying pressures are starting to become less sticky in response to the increasingly restrictive monetary policy environment.
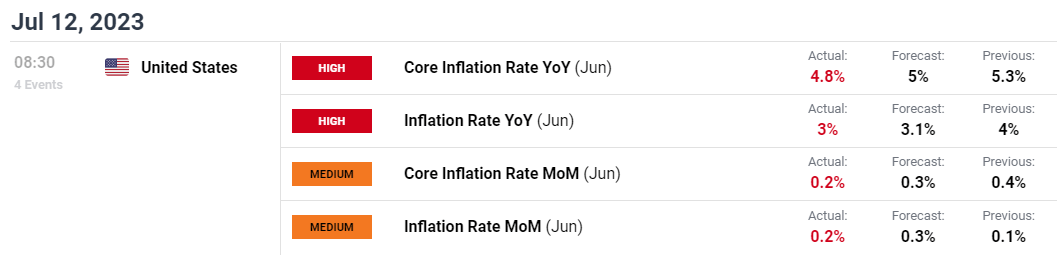
Source: DailyFX Economic Calendar
The encouraging inflation report triggered a dovish repricing of interest rate expectations, leading to a drop in Treasury yields across all maturities, especially at the front end of the curve. Although the odds of a quarter-point hike in July were largely unaffected and remained above 90%, traders unwound wagers of additional tightening at the September FOMC meeting, effectively positioning for what could be the end of the Federal Reserve’s normalization campaign.

US DOLLAR AND YIELDS’ REACTION TO US CPI REPORT
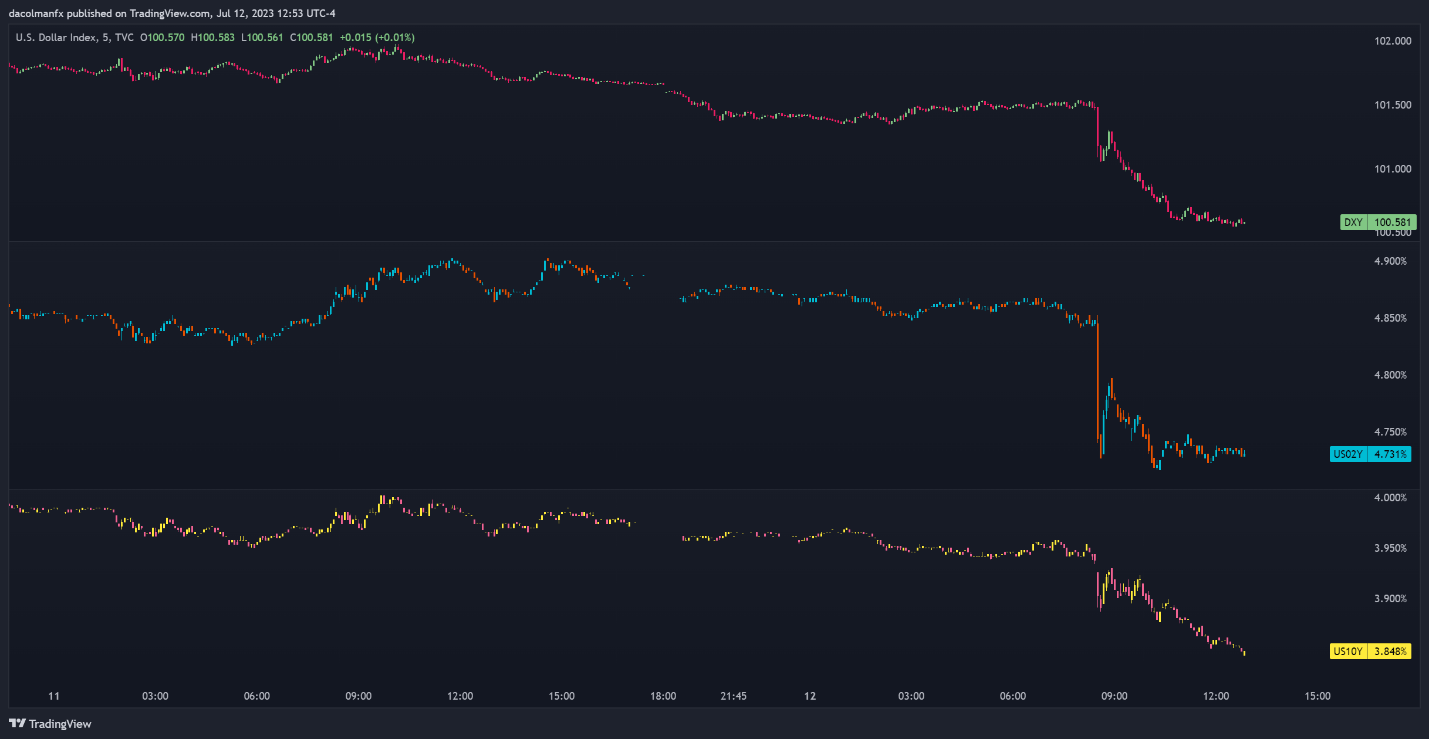
The market's reassessment of the Fed's path triggered a massive sell-off in the U.S. dollar, sending the DXY index towards its weakest point in nearly 25 months. Against this backdrop, EUR/USD soared more than 1.10%, breaking above the 1.1100 barrier and reaching its strongest mark since March 2022. GBP/USD also managed to stage a solid rally, coming within striking distance from capturing the elusive 1.3000 handle.
| Change in | Longs | Shorts | OI |
| Daily | -9% | 9% | -2% |
| Weekly | -4% | 5% | 0% |
GOLD PRICES OUTLOOK
With nominal and real yields taking a turn to the downside, gold may regain its poise in the near term, but the rebound could be short-lived if incoming data on activity and labor markets remain resilient. For this reason, traders should stay laser-focused on the economic calendar in the days and weeks ahead.
From a technical standpoint, gold futures rose above the $1,940 barrier after Wednesday’s furious rally but fell short of overtaking its 50-day simple moving average and overhead resistance at $1,975. Although the yellow metal may struggle to break above this area, a bullish breakout is still possible and, if confirmed, could open the door to a retest of the psychological $2,000 level.
On the flip side, if sellers regain the upper hand and spark a bearish turnaround, initial support appears at $1,940, followed by $1,907, the 38.2% Fibonacci retracement of the November 2022/May 2023 advance. On further weakness, the focus would shift to $1,880.
GOLD FUTURES CHART
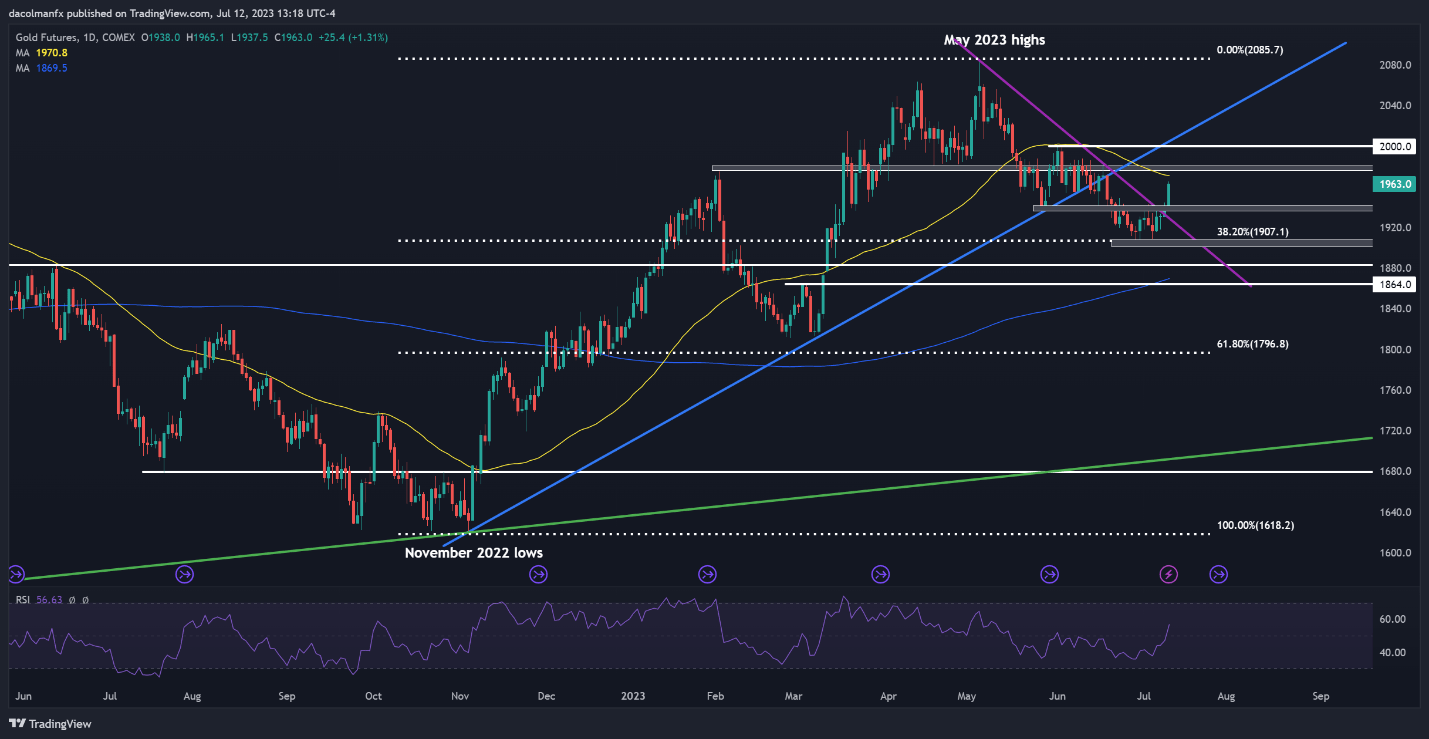
Gold Prices Chart Prepared Using TradingView

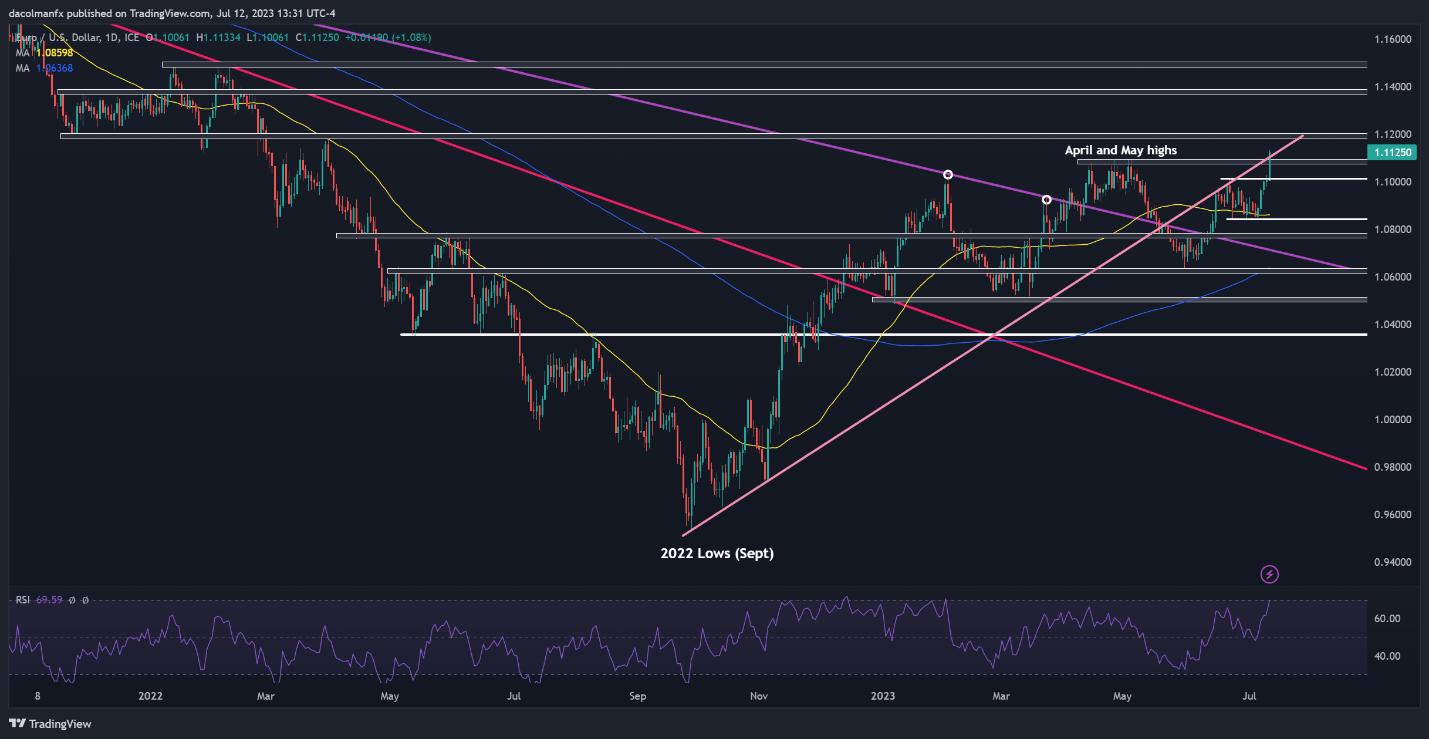
EUR/USD OUTLOOK
EUR/USD surged on Wednesday, breaking above its April and May highs and reaching its best quote since March 2022. If this breakout is sustained in the coming days, bulls may become emboldened to initiate an assault on the psychological 1.1200 level, the next resistance in play. On further strength, we can’t rule out a move toward 1.1375.
Conversely, if bullish impetus fades and the pair begins to retrace, the first technical support to keep an eye on is located around the 1.1080 area, but additional losses may be in store on a push below this floor, with the next downside target 1.1010, followed by 1.0840.
EUR/USD TECHNICAL CHART
EUR/USD Chart Prepared Using TradingView