


Canadian Dollar Talking Points:
- Canadian Dollar weakness continues as CAD has been one of the few major currencies weaker than the USD.
- CAD/JPY went deeper into breakdown last night, illustrating how ‘the trend is your friend,’ following the setup that I looked at in early-November, which started to open the door for bearish reversals in CAD/JPY. The pair is now more than 1,000 pips lower with the recent help from the Bank of Japan.
- The analysis contained in article relies on price action and chart formations. To learn more about price action or chart patterns, check out our DailyFX Education section.

The Canadian Dollar continues as one of the weaker global currencies, even weaker than the US Dollar as I had looked at multiple times over the past month. In USD/CAD, despite DXY digging deeper and selling off over the past month, USD/CAD has actually had a bullish trajectory, setting up an ascending triangle formation. This highlights just how weak the CAD has been – weak enough to not only outstrip that USD weakness but also weak enough to actually create some bullish movement in the USD/CAD pair.
But, perhaps more compelling is the CAD/JPY setup that I’ve been tracking. What started as a breakout from a symmetrical triangle has now run for more than 1,000 pips as a spot of long-term Fibonacci support has come into play. And EUR/CAD has remained on a consistent bullish trend, again owed largely to that CAD-weakness, and the pair is now finding resistance at the 2022 highs, the same area that was holding resistance back in February of this year. Below, I parse through each pair.
USD/CAD
The US Dollar has been weak and this is well-illustrated in the DXY chart. After a blistering trend in the first nine months of this year, Q4 has so far been retracement in the USD, and that’s helped to lift many major pairs like EUR/USD, GBP/USD and even AUD/USD.
And that USD weakness initially did show in USD/CAD – from October 13th until November 15th and 16th, when a spot of support came into play at prior resistance, plotted at 1.3224. I had highlighted this level when it came into play a little more than a month ago and as we stand, that level marks the current three-month-low.
Since mid-November, however, CAD-weakness has set the pace for the major pair and price action has pushed up to resistance at the 1.3700 handle, which has now held through multiple attempts from bulls to force a breakout.
USD/CAD Daily Price Chart
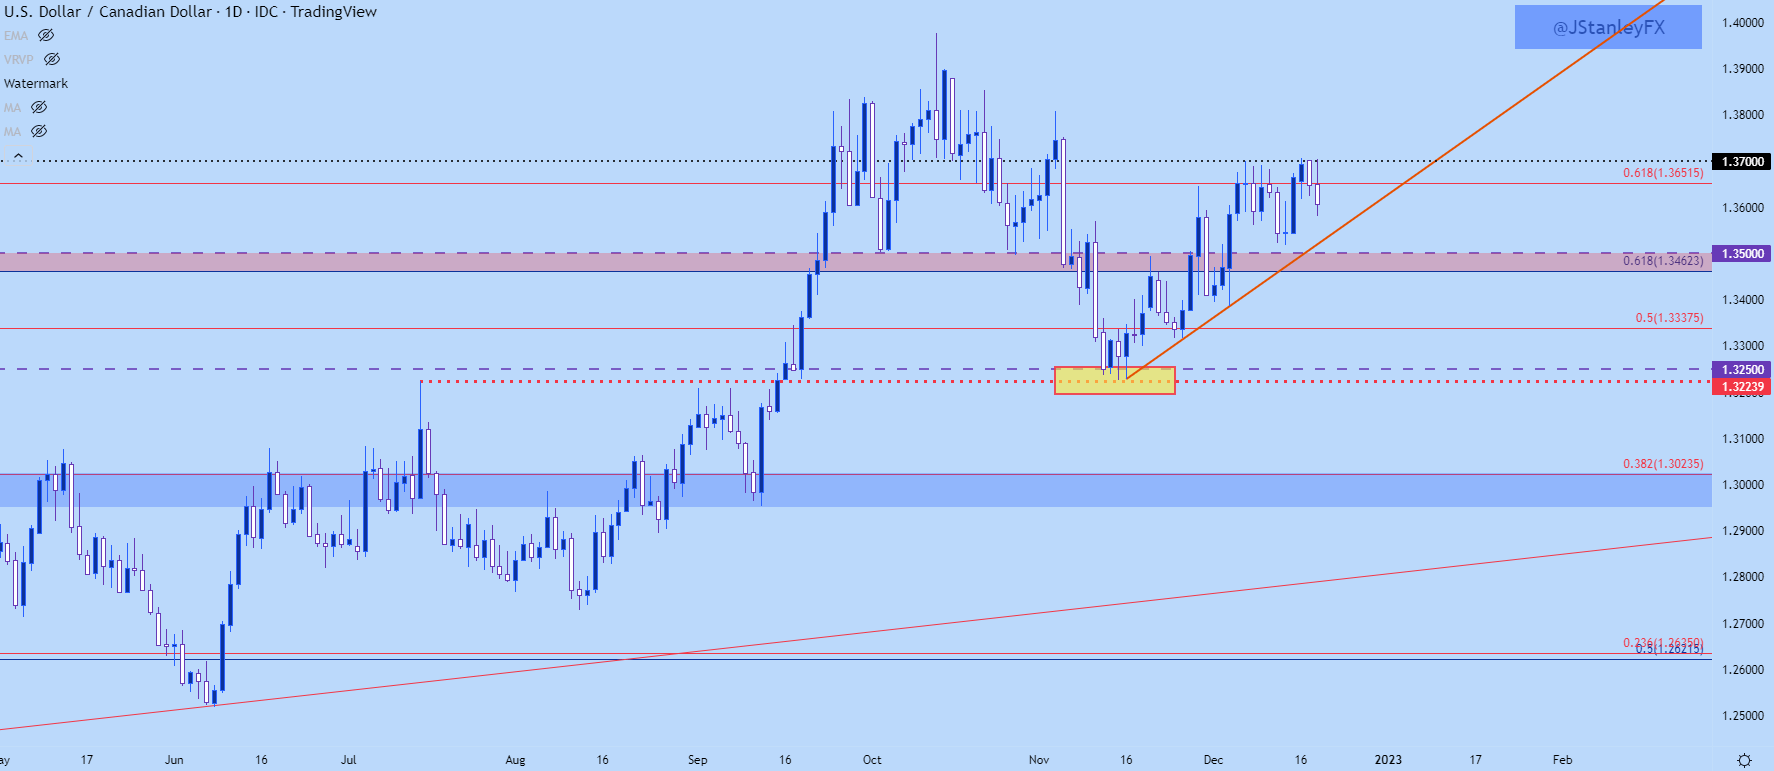
Chart prepared by James Stanley; USDCAD on Tradingview
USD/CAD Shorter-Term
At this point the pair is pulling back after another failed breakout attempt. The big question now is where support may show up, and there’s a spot of confluence just above the 1.3500 psychological level, taken from a bullish trendline connecting the lows since mid-November combined with the December swing low.
USD/CAD Four-Hour Chart
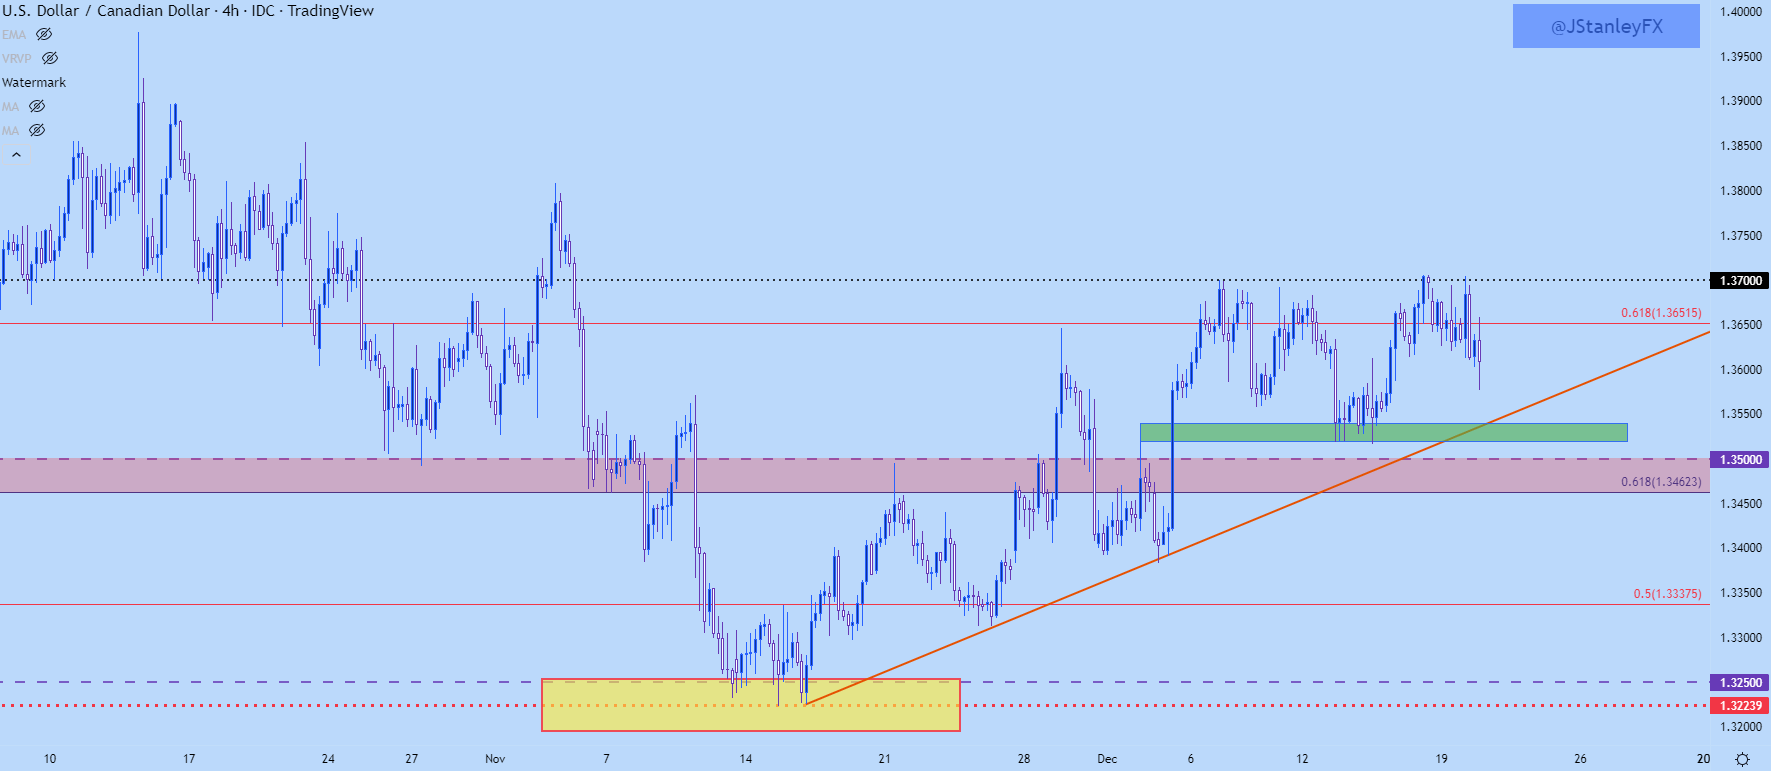
Chart prepared by James Stanley; USDCAD on Tradingview
USD/CAD Bigger Picture
USD/CAD has been pretty strong even with the US Dollar showing weakness, so if USD-strength comes back, there could be an attractive backdrop for breakout potential in USD/CAD. The 1.4000 level sticks out as a point of reference, as this level almost came into play a couple months ago with bulls stalling about 23 pips below the big figure.
USD/CAD Weekly Chart
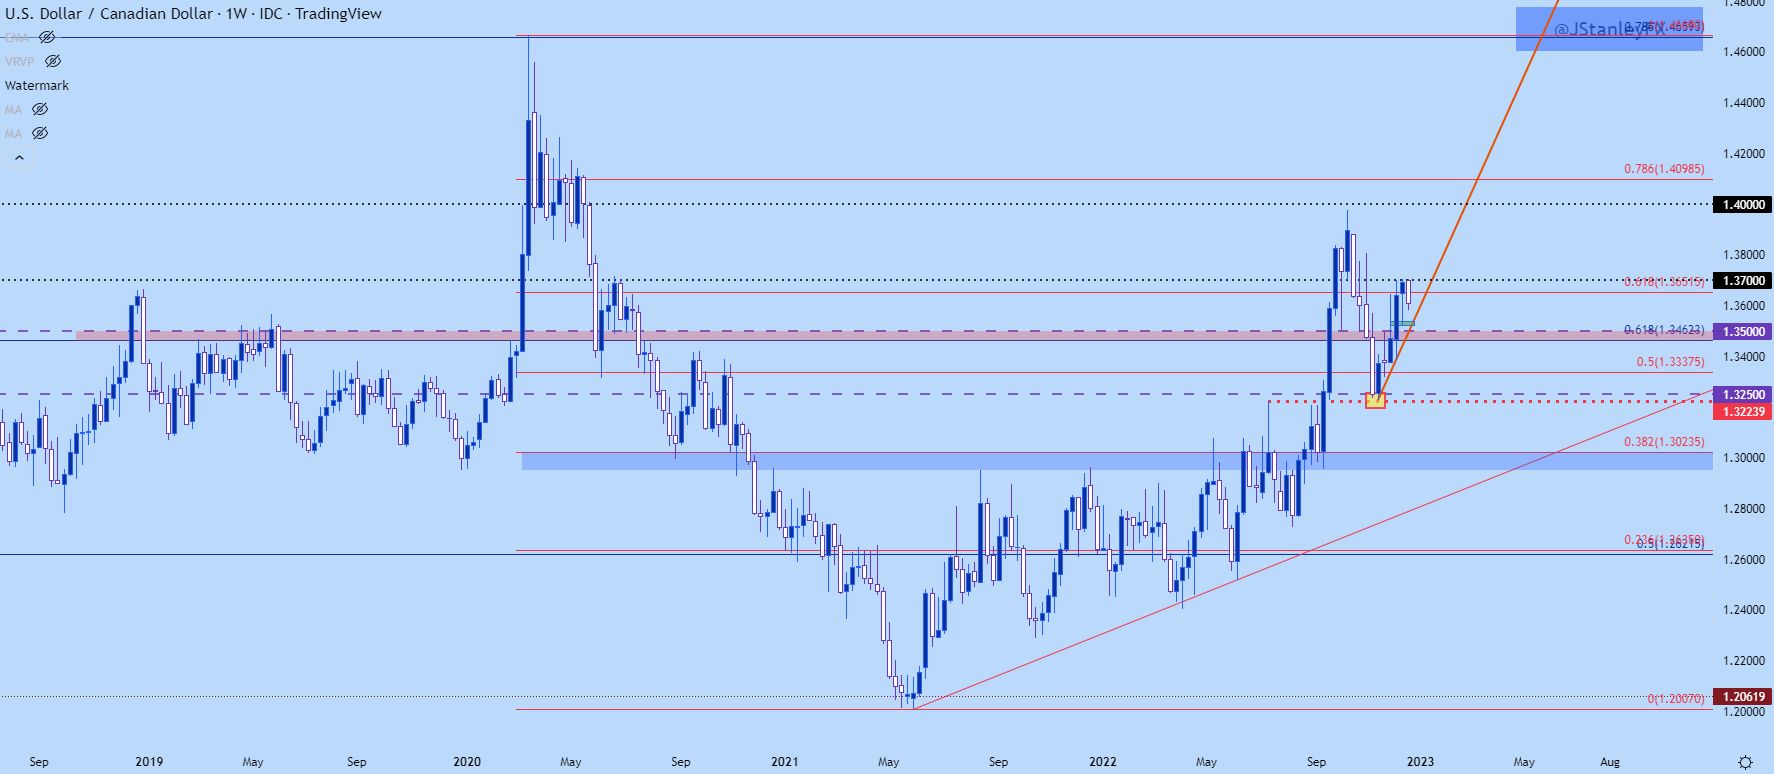
Chart prepared by James Stanley; USDCAD on Tradingview
CAD/JPY
When I was looking into CAD back in mid-November as USD/CAD was sitting on support, the prospect of broad-based CAD-weakness wasn’t as widely-accepted yet. CAD/JPY and EUR/CAD had backdrops that both appeared to be more amenable to CAD-weakness scenarios and a little more than a month later CAD/JPY is more than 1,000 pips off.
Of course, the more recent driver to the pair, broad-based JPY strength, wasn’t part of my calculation at the time. But, this exudes the benefit of sticking with the trend, as the reversal that started in November has only picked up steam as favorable headlines have helped to push prices-lower.
Price broke from the symmetrical triangle in early-November, and then quickly breached the trendline, which led to a run down to the 100 psychological level, which held the lows for the past couple of weeks until last night’s breakdown.
At this point, the pair is very stretched and finding support at a Fibonacci level plotted at 96.55. Prior support now becomes resistance potential, and this is plotted around the 99.49-100.00 area of prior support.
This market is still weak: The complication is timing as it’s already printed a really large move.
CAD/JPY Daily Price Chart
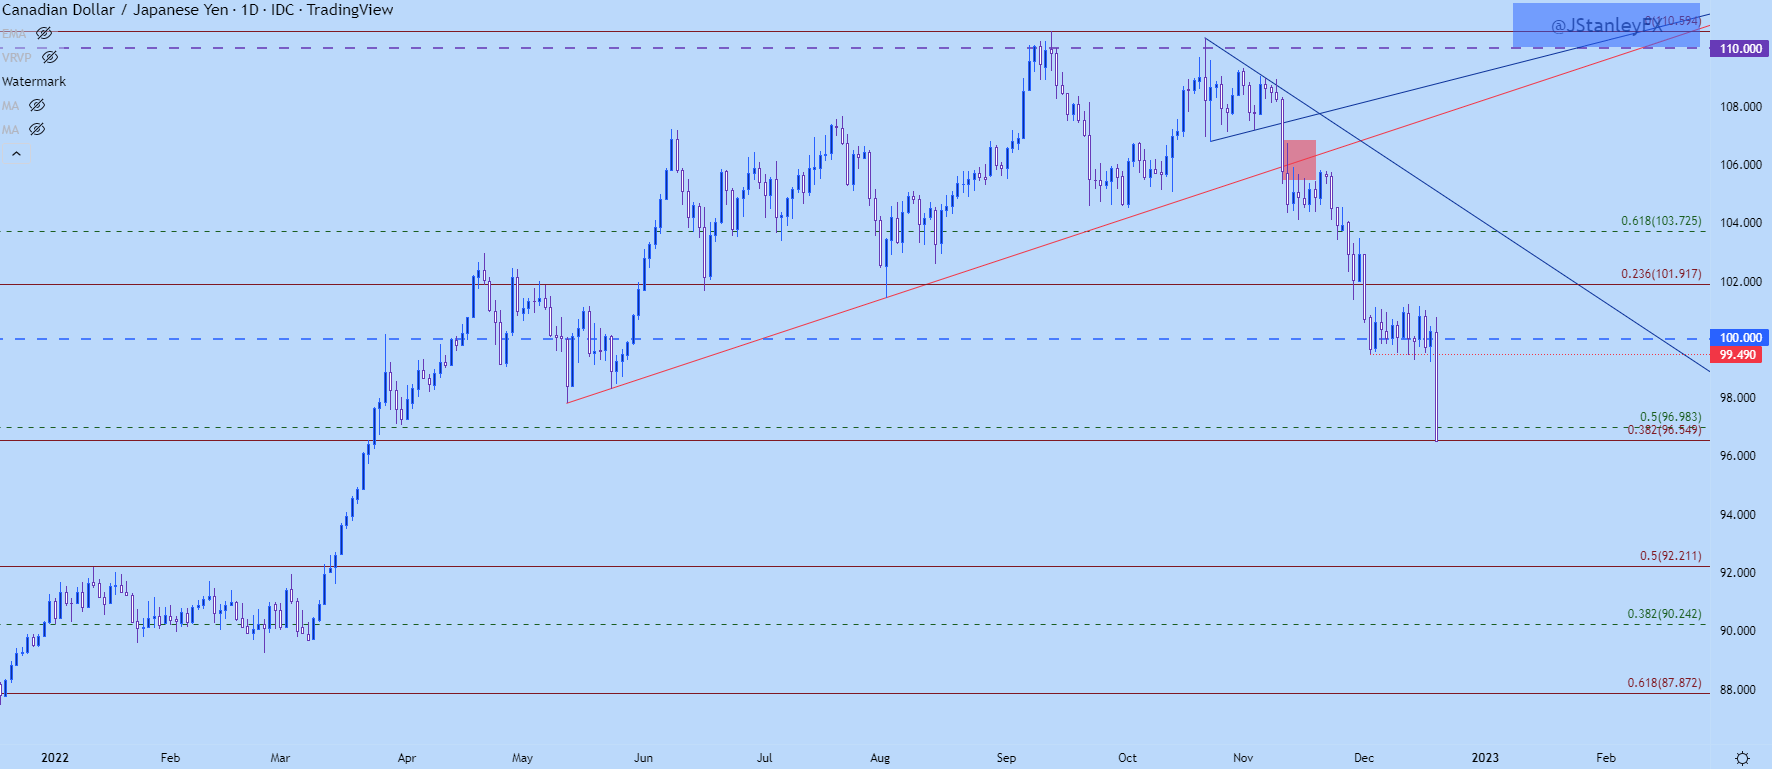
Chart prepared by James Stanley; CADJPY on Tradingview
EUR/CAD
When I started lining up bullish setups in EUR/CAD last month, price was just starting to work through a bullish push on the 200 day moving average. Similar to CAD/JPY above, the pair has since moved by more than 1,000 pips with CAD-weakness playing a large role in the move.
At this point, prices has now retraced as much as 76.4% of the bearish trend that started last September, with resistance starting to show at a Fibonacci level as weekly RSI is showing is overbought for the first time in the pair since early-2020.
EUR/CAD Weekly Chart
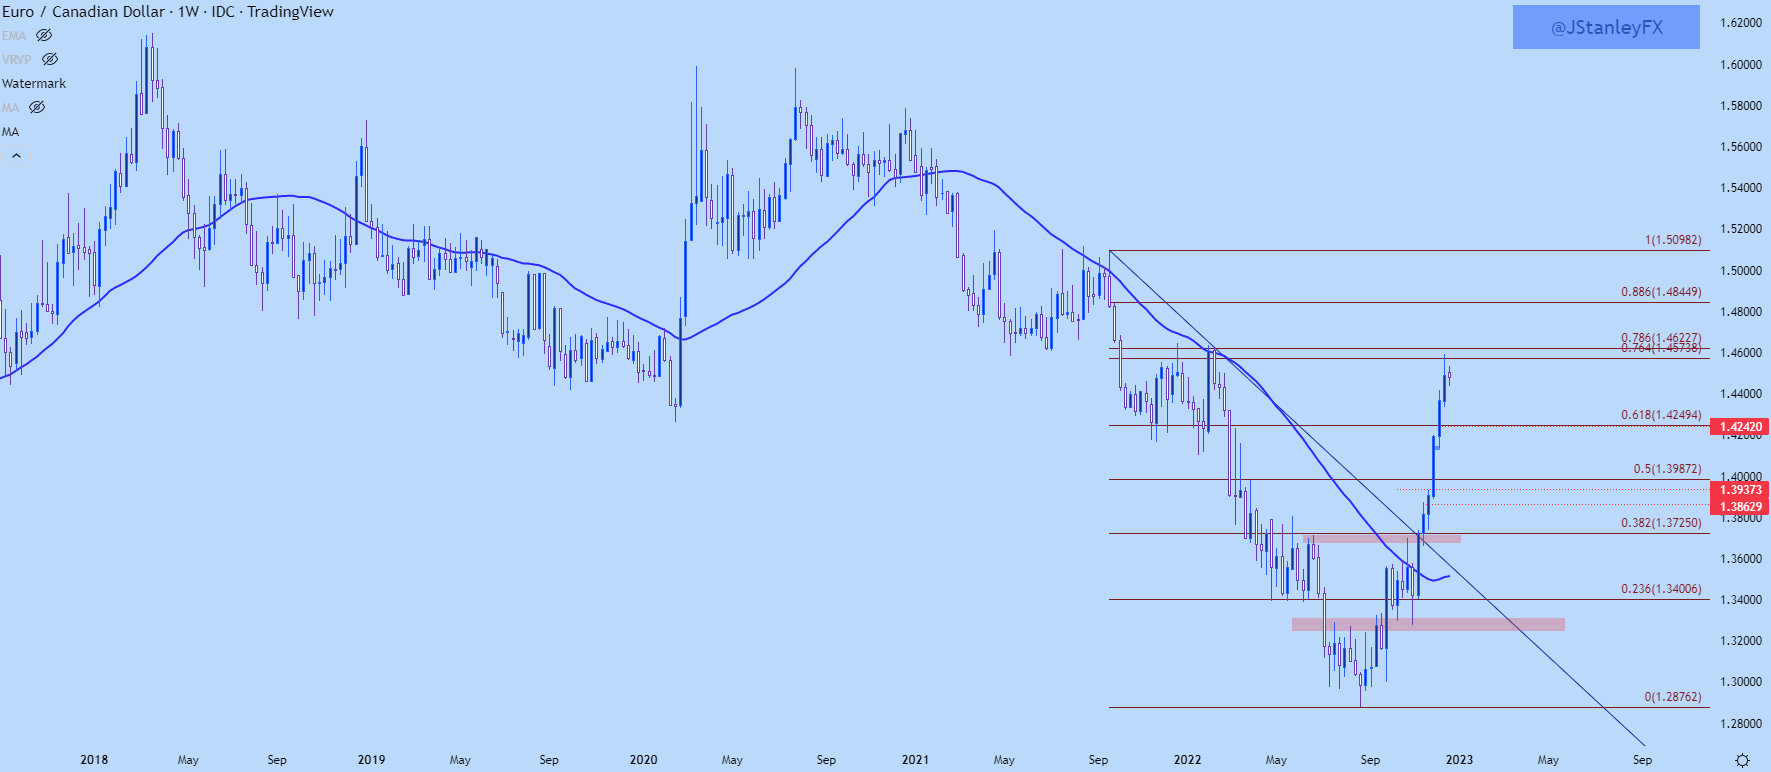
Chart prepared by James Stanley; EURCAD on Tradingview
EUR/CAD
From shorter-term charts, we can see where there’s no evidence yet that the trend is ready to turn but, on the same token, there’s a pretty clear spot of resistance that’s started to stifle the highs. On top of that, there’s been some pretty considerable upper wicks on daily candles of late, which is indicative of bulls selling after fresh highs, indicating that we may be nearing a pullback.
Given how strong the trend had run, plotting that point of pullback can be a challenge. If we draw a Fib retracement on the recent bullish move, a few spots line up but nothing that’s close by. There’s confluence between the 23.6% retracement and another Fibonacci level, with a zone from 1.4188-1.4250, and another around the 38.2% retracement just inside of the 1.4000 psychological level.
EUR/CAD Daily Chart
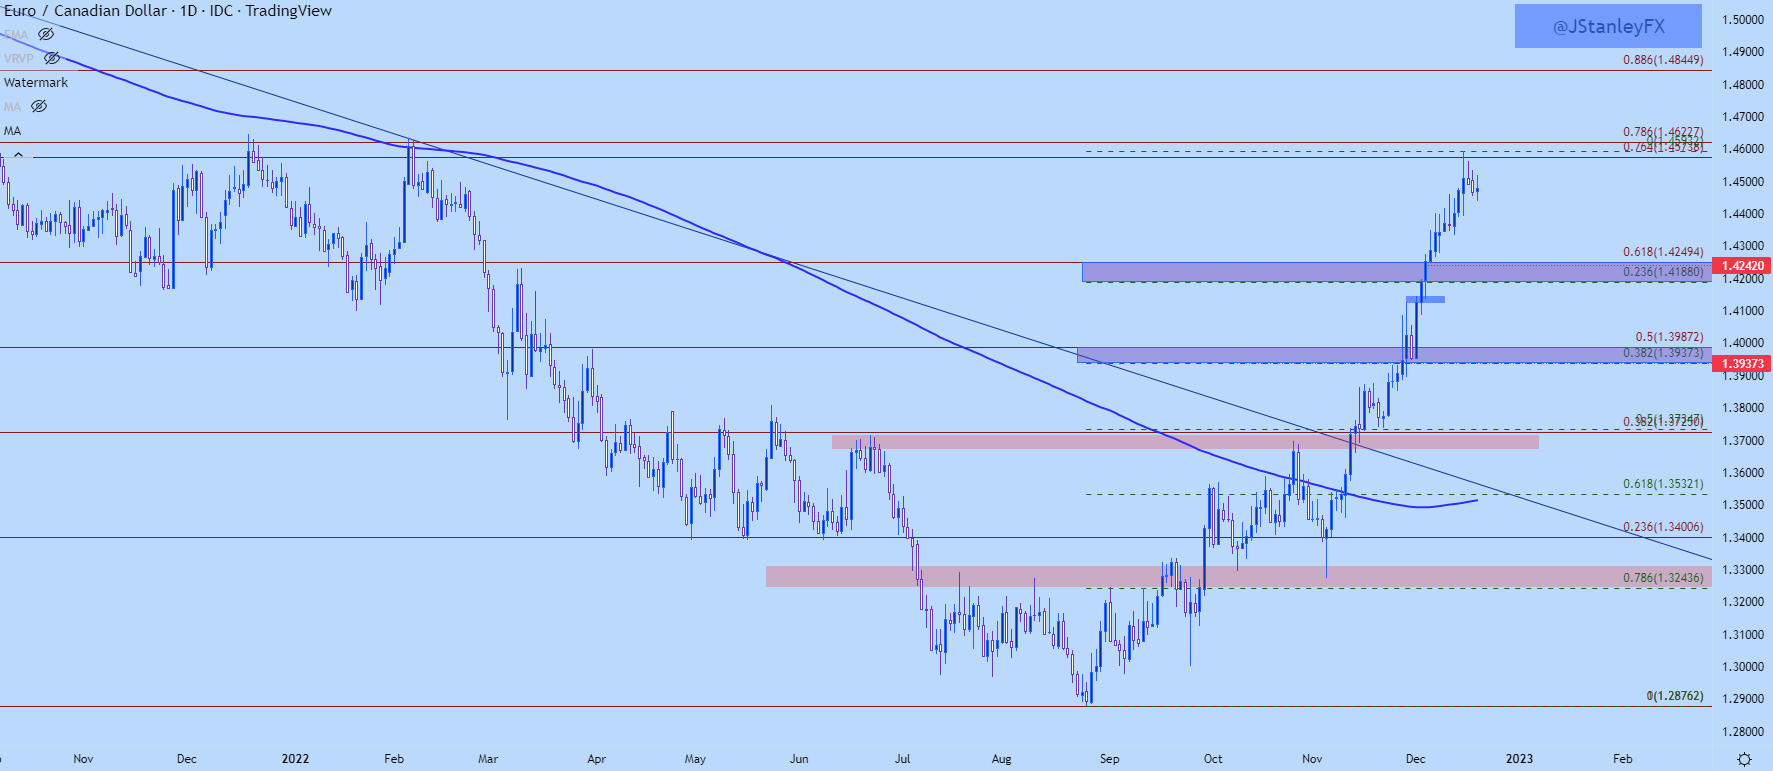
Chart prepared by James Stanley; EURCAD on Tradingview
--- Written by James Stanley
Contact and follow James on Twitter: @JStanleyFX


