


USD/JPY Price and Chart Analysis
- Bank of Japan leaves rates unchanged but adjusts its yield curve control settings.
- USD/JPY goes straight through prior support and eyes 130.00s.

Most Read: Japanese Yen (USD/JPY) Outlook – The Battle with Technical Support Resumes
The BoJ today left its policy rate unchanged at -0.1% but changed the rates at which the central bank can buy Japanese Government debt (JGBs). The prior band of -0.25% to +0.25% around zero was widened to -0.50% to +0.50%, allowing JGB bond yields out to 10 years to rise. This move is seen as the first hawkish turn by the BoJ who have kept monetary policy ultra-loose in the past years.
US Dollar Benefits as BoJ Capitulates to Tighter Policy, Sinking Risk Assets
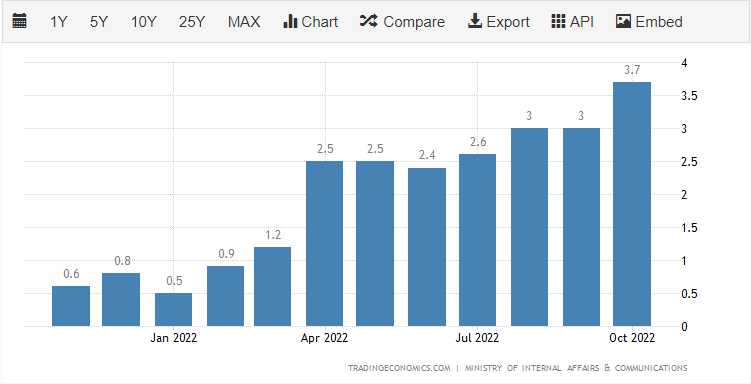
Inflationary pressures in Japan have been building over the last year with last month’s October cpi reading of 3.7% y/y the highest level seen in four decades. The November report is released this Thursday at 23:30 GMT and is expected to show a further rise in domestic price pressures.

Today’s sharp move lower in USD/JPY has changed the technical picture bearish with the pair now back to levels last seen four months ago. The pair has broken below the 200-day moving average with conviction and this indicator will now act as resistance. The pair have also printed a new lower low, keeping in play a series of lower highs and lower lows seen from the October 151.94 high trade. Initial resistance is seen at 133.63 while support at 131.58 may come under pressure soon. A break below here sees 130.40 as the next target.
USD/JPY Daily Price Chart – December 20, 2022
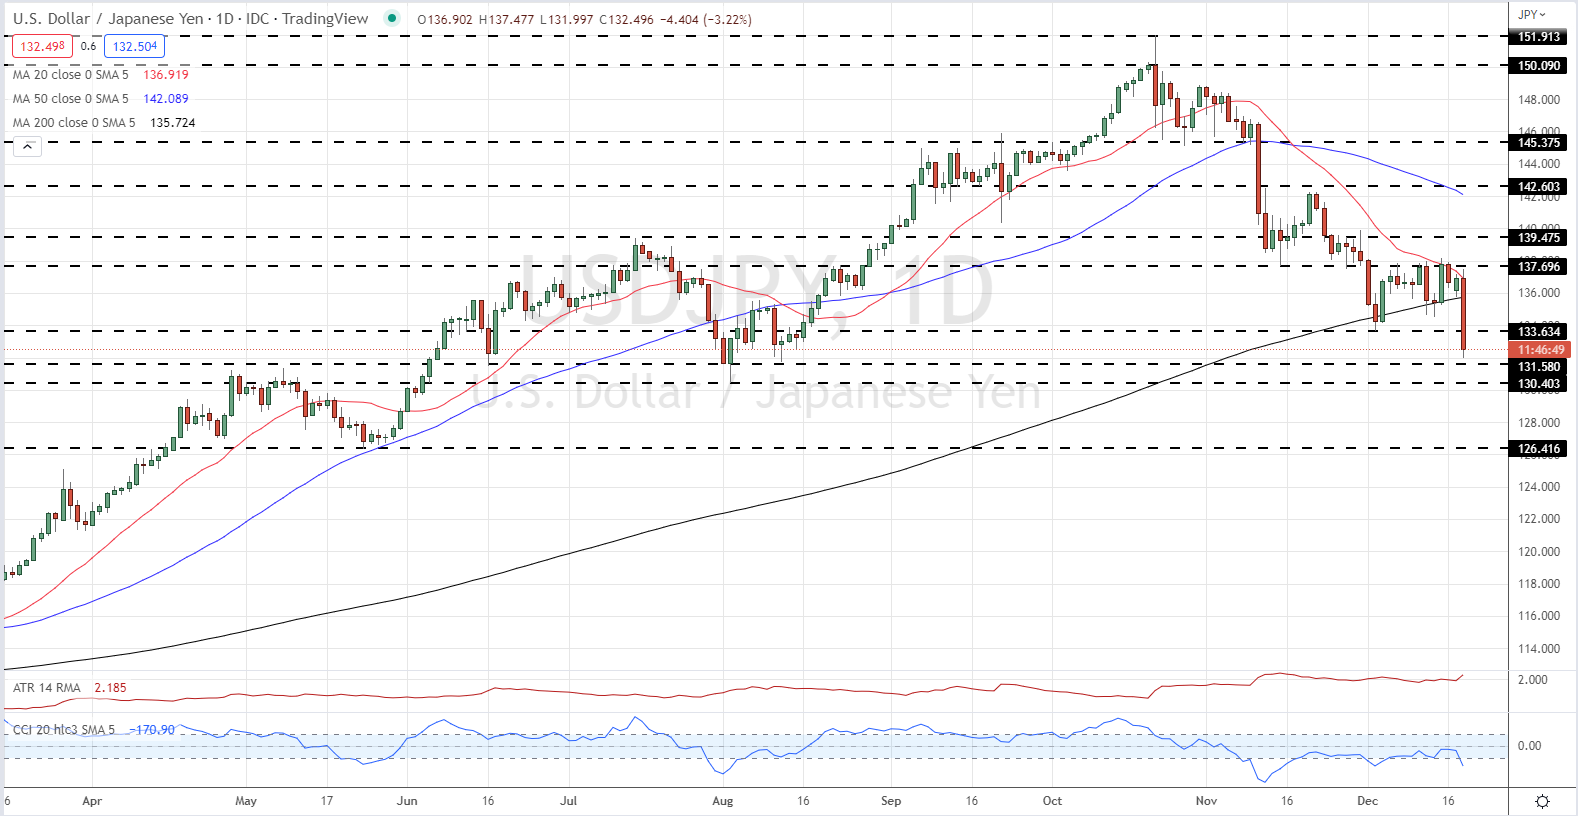
Chart via TradingView
| Change in | Longs | Shorts | OI |
| Daily | -2% | 2% | 0% |
| Weekly | 12% | -16% | -6% |
Retail Traders Build USD/JPY Net-Longs
Retail trader data show 51.93% of traders are net-long with the ratio of traders long to short at 1.08 to 1.The number of traders net-long is 9.72% higher than yesterday and 19.32% higher from last week, while the number of traders net-short is 14.97% lower than yesterday and 24.56% lower from last week.
We typically take a contrarian view to crowd sentiment, and the fact traders are net-long suggests USD/JPY prices may continue to fall. Traders are further net-long than yesterday and last week, and the combination of current sentiment and recent changes gives us a stronger USD/JPY-bearish contrarian trading bias.
What is your view on the USD/JPY – bullish or bearish?? You can let us know via the form at the end of this piece or you can contact the author via Twitter @nickcawley1.


