Looking ahead into the last quarter of the year, the British Pound looks exposed to further downside, especially if the Bank of England leaves interest rates untouched. Looking at three different Sterling-pairs, GBP/USD may struggle to move higher, EUR/GBP needs to hold a multi-month range, while GBP/JPY may be vulnerable to a hawkish Bank of Japan (not something that’s been heard for some time).
GBP/USD – Mired at Multi-Month Lows
Cable has suffered since early July from a strengthening US dollar that has dominated FX price action against a range of currencies. Dollar strength, backed up by multi-year high US Treasury yields, may push GBP/USD down further but further into Q4 this may change with cable pushing higher on firming expectations that the Federal Reserve is done with hiking rates. The technical picture does look negative with GBP/USD below all three simple moving averages, and with lower highs and lower lows all over the chart since early Q3. A cluster of old daily highs and lows on either side of 1.2200 is the next likely stopping point if the sell-off continues, followed by 1.2000. A confirmed break here sees 1.1804 come into play. If cable can regain the 200-day SMA, currently at 1.2432, the picture becomes slightly better with 1.2447 and 1.2547 the next two points of interest.
GBP/USD Daily Price Chart
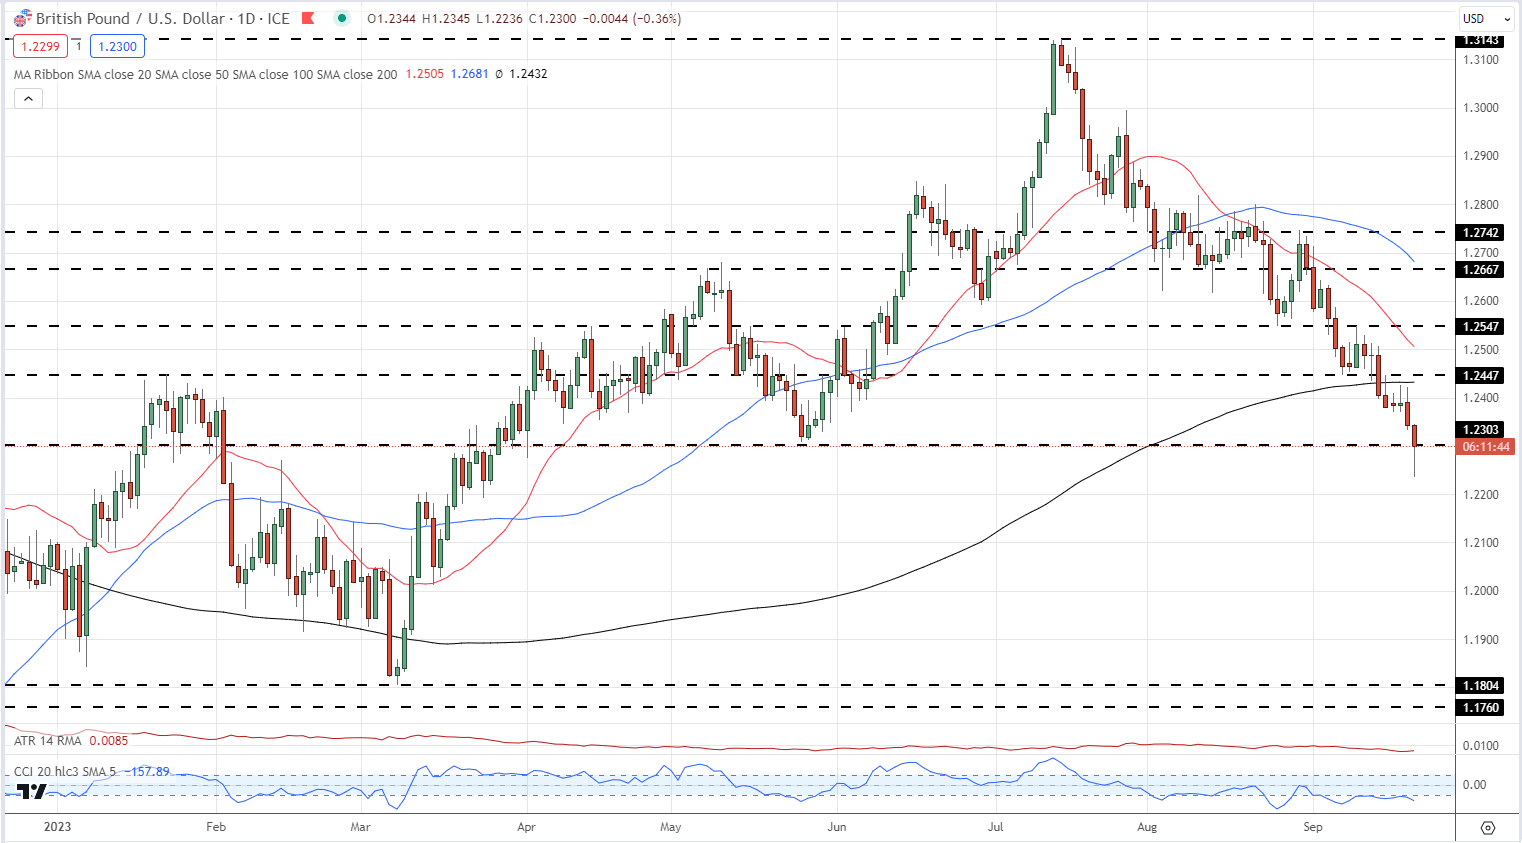
Source: TradingView, Prepared by Nick Cawley
This article is dedicated to examining the technical side of the British Pound. If you're seeking a deeper understanding of the fundamental outlook and the pivotal drivers shaping Sterling's prospects in the medium term, download DailyFX's all-inclusive fourth-quarter trading guide. The best part? It's free!

EUR/GBP – Will the Range Remain Intact?
EUR/GBP has been one for the slightly longer-term range traders since May this year with a range of 0.8500 to 0.8720 holding price action. The Euro’s economic woes are seemingly on par with the UK and so the latest move towards resistance may offer up an opportunity to enter a short position if resistance holds. The 200-day SMA is overhead and may offer initial resistance around a current level of 0.8710. The CCI indicator suggests the pair are overbought and this may help stem further upside. A confirmed break of resistance however brings 0.8828 into play.
EUR/GBP Daily Price Chart
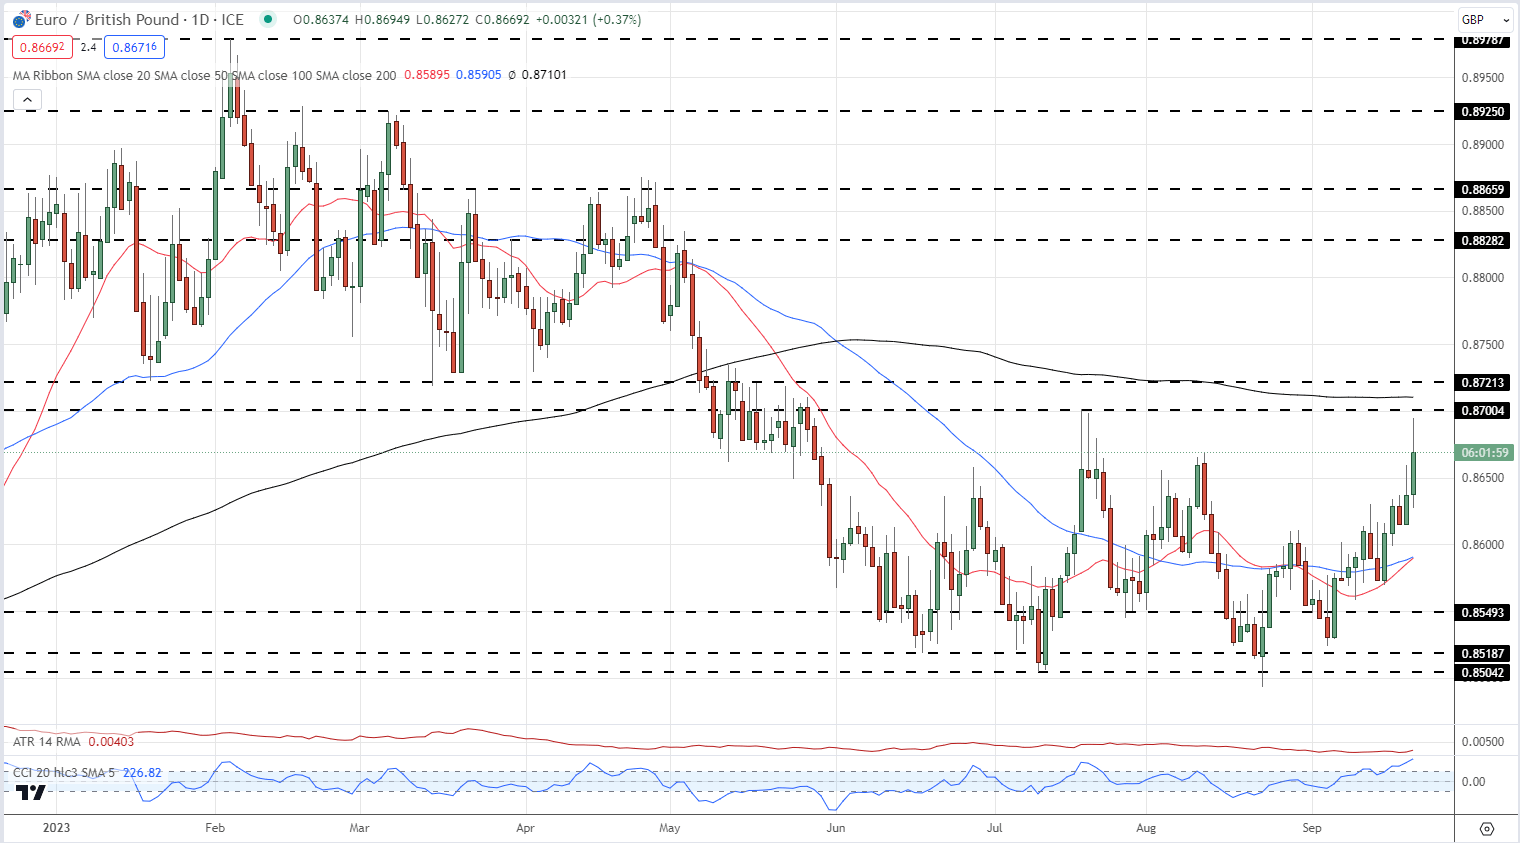
Source: TradingView, Prepared by Nick Cawley
If you wish to delve deeper into the fundamental outlook and the key catalysts shaping Sterling's trajectory in the medium term, grab your complete fourth-quarter trading guide by clicking the link below!
GBP/JPY – All Eyes on the Bank of Japan
Long GBP/JPY has been a one-way trade since the start of the year as the pair rallied from 155 to a peak of 186.35 in late August. Subsequent attempts to break higher failed and GBP/JPY has been moving slowly lower. As we write, GBP/JPY is making a fresh push lower, in part on growing expectations that the Bank of Japan may soon announce that they are looking at tighter monetary policy, or by firm guidance that Japanese officials want to see the Yen strengthen. Initial support at around 180 is being tested, leaving the late July spike low at 176.25 the next level of interest. Below here 172 and 169 come into play. The pair are below the 20- and 50-day SMAs but above the 200-day SMA, while the CCI indicator shows the pair as oversold.
GBP/JPY Daily Price Chart
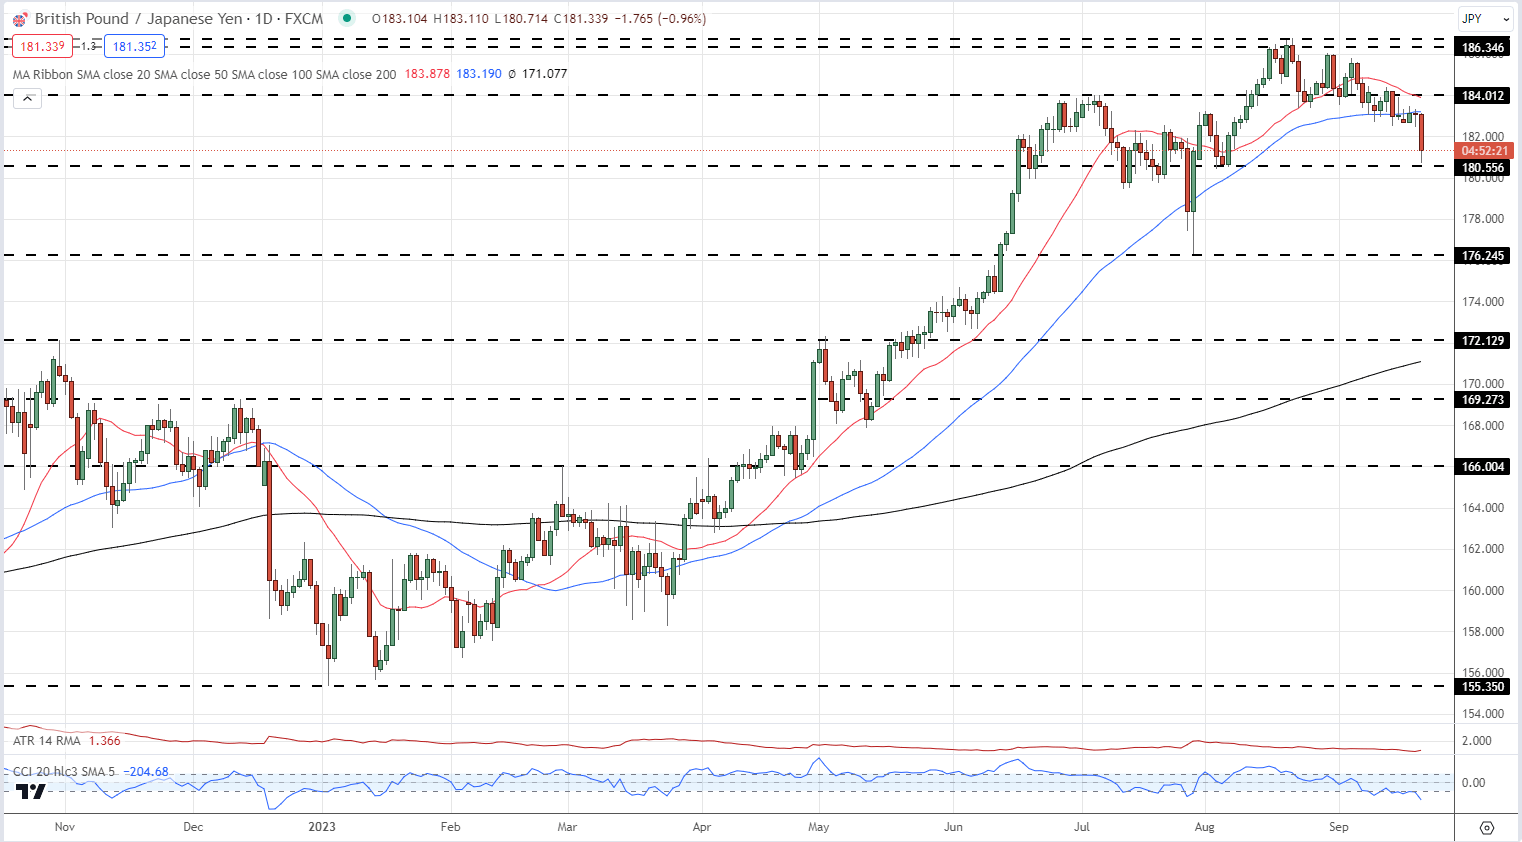
Source: TradingView, Prepared by Nick Cawley
If trading losses have you feeling puzzled, our guide, "Traits of Successful Traders," is a must-have. It provides practical tips to help you steer clear of common errors that can lead to financial setbacks.