


EURUSD, S&P 500, VIX and Liquidity Talking Points:
- The Market Perspective: EURUSD Bearish Below 1.0550; USDJPY Bearish Below 132
- After weeks of falling into an ever-constricting range, EURUSD finally forced a break on a Dollar-driven dive through 1.0580
- The S&P 500 opened the new year with a -0.4 percent decline on an increase in volume and jump in the VIX – will we still fulfill the 1st week bullish average?

Happy New Year. Most of the world’s largest markets are back online after extended holiday exchange breaks and observed periods of thin liquidity. We are still in the wash that is typical when markets throttle back up to full participation and fundamental priorities are worked out from the stilly-hazy trading masses trying to sort 2022 issues from new motivations. Unless there is a systemic shock to the system (good or bad), it will likely take the markets a little time to determine what its principal driver is moving forward…even if we do inevitably land on the same critical fundamental themes as before. With that in mind, I was observing the volatility that we would realize this past session with an eye to possible undercurrents. For EURUSD, the first full day produced a significant -1.1 percent drop that readily cleared the range of the past three weeks.
From a technical perspective, this registers as an overdue effort to clear a tight range following a strong counter-trend rally. That represents holiday-forced pressure building up on a provocative effort to reverse one of the most prominent trends in the financial markets through the past year: the Dollar climb. Trying to find a fundamental spark to justify the run is an effort to explain after the fact. With little data and limited traction on major themes, this was likely a liquidity response. That begs the question as to whether fundamentals will start to take over with heavier event risk ahead (and whether it supports this new direction) or whether the absence of weightier fare will allow speculative interests to unfold.
| Change in | Longs | Shorts | OI |
| Daily | -1% | -4% | -3% |
| Weekly | 4% | -10% | -5% |
Chart of the EURUSD with 20 and 100-Day SMAs, 5-Day Historical Range (Daily)
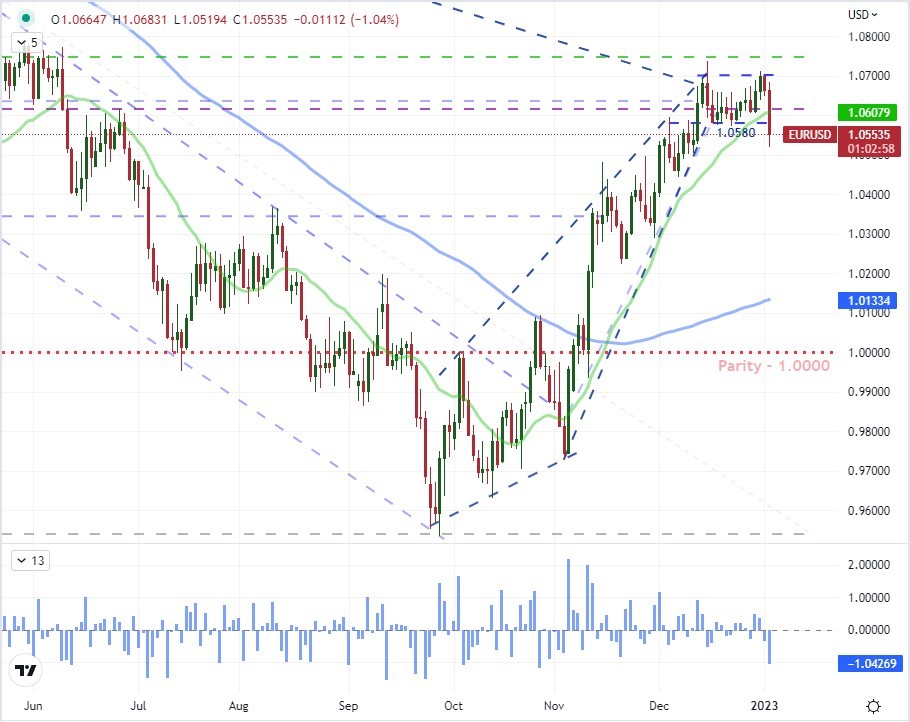
Chart Created on Tradingview Platform
Looking to a more traditional measure of the broader speculative markets, the S&P 500 was putting in for a much more controlled performance. The benchmark equity index managed a more restrained -0.4 percent loss on the first day of exchange-based trade of the New Year. That and the day’s entire range fit neatly into the previous 10 days’ established territory. There is significant technical heft to the congestion that we are currently looking at between the midpoint of the past three-month’s range (3,910) and the confluence of support down around 3,800. That will likely harden the market’s willingness to resolve with a ‘break of necessity’ (a break where volatility forces the bounds but without a charge for follow through). Nevertheless, the past 11-day range matches the smallest trading band for this index since November 2021 and volatility is likely to only pick up alongside volume. Should one or more fundamental events on tap ahead charge the break, it could offer better traction.
Chart of the S&P 500 with Volume, VIX and 20-Day ATR (Daily)
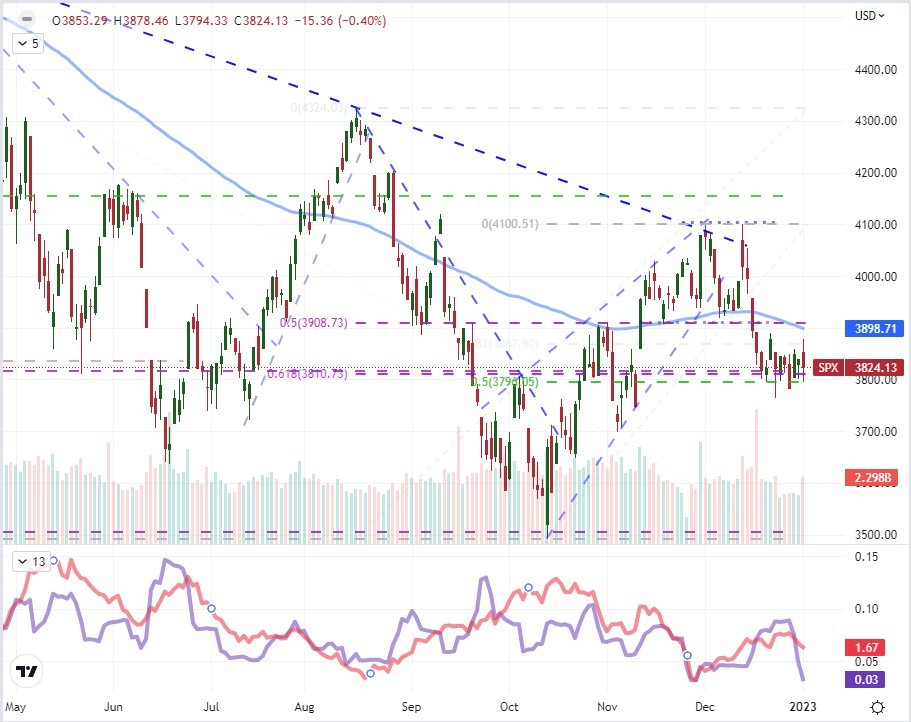
Chart Created on Tradingview Platform
Considering that we are still caught up in some seasonal market conditions, I think it is worth looking back in history to see if there is any material consistency from the markets in terms of the opening day of the year. On average, the first full trading day of each year for the S&P 500 back to 1958 registers a tepid -0.2 percent loss. The split between gains and losses is fairly even and it is the outlier whereby the opening day recorded a major gain or loss. One of the key criteria of that volatility is the carry over of market-volatility late into the previous year or the pick up of a critical fundamental theme – neither of which we have heading into 2023…yet.
Table of S&P 500’s First-Day Performance of Each Trading Year back to 1958
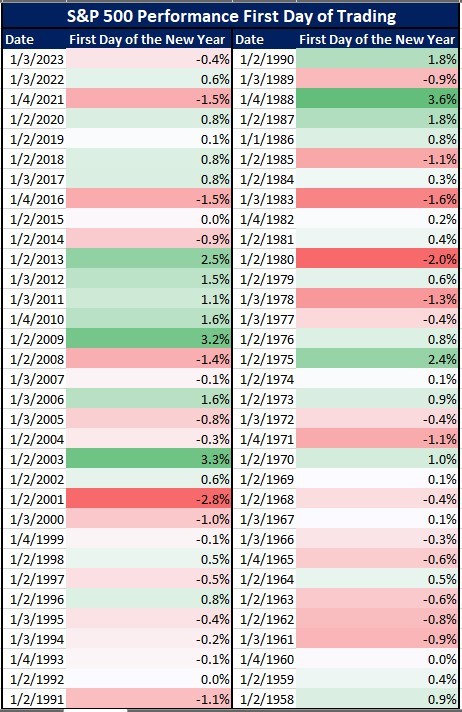
Table Created by John Kicklighter
Extending the historical time frame a bit to look at the first full week of the year, history does suggest – with statistical relevance – that this longer opening period has averaged a more significant and distinct performance. From 1900 to 2021, the S&P 500 has averaged a 1.0 percent gain through the opening week of the year. Logically, that fits the capital allocation expectations that occur through funds and managers that need to redistribute capital and set portfolios. In practice, the speculative crosswinds can distort and disrupt that norm in a material way. The backdrop of just closing out the worst year for the capital markets (or at least US equities) since 2008 is a definite skew. However, the drivers behind that performance – rate speculation, supply chain issues, recession pressure – are not yet under power. In the absence of a stronger force, the assumptions behind seasonal norms can win out.
Chart of S&P 500 Average Performance by Calendar Week Back to 1900 (Weekly)
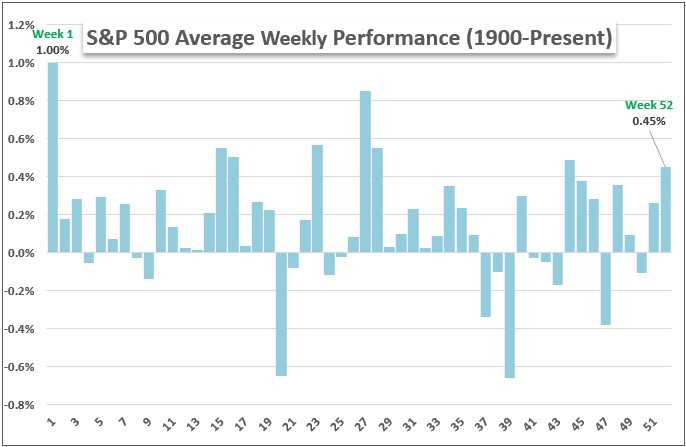
Chart Created by John Kicklighter
While systemic fundamental themes can developed unpredictably, we generally have the benefit of known catalysts along the way that can facilitate market progress. The docket ahead has the capacity to dig into some of the systemically important themes. Most notable on my radar is the concern around recession risks in 2023. We have already heard from the IMF Managing Director earlier this week that the institution believes one third of the world’s countries will fall into recession – and it will feel like a recession for many others. The US 2-10 spread has turned back into a steepening inversion for a market reflection. With that said, the ISM manufacturing survey for December can rouse those latent concerns – but so too can the JOLTS job openings and quits stats before Friday’s NFPs. As for interest rate speculation as a driver, the FOMC meeting minutes will tap into the conversation; but it may take a significant surprise to get the market moving on this well-traveled theme.
Top Macro Economic Event Risk Through Week’s End
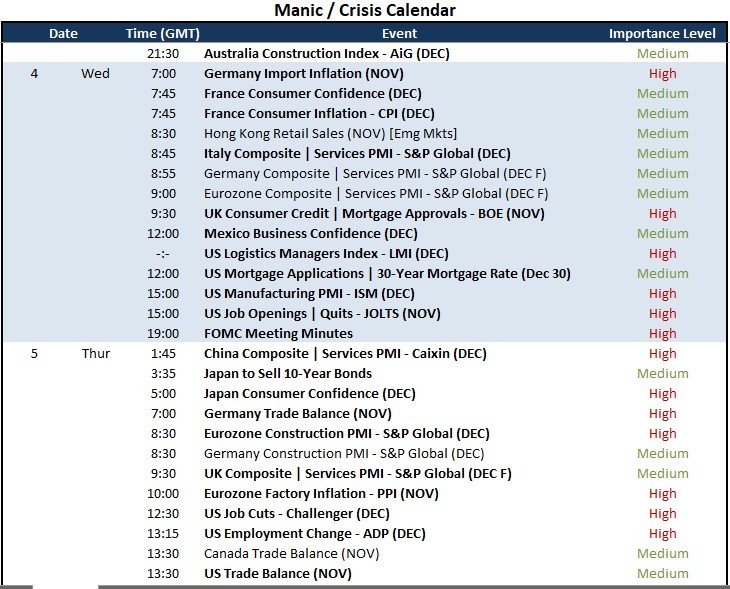
Calendar Created by John Kicklighter


