Article by IG Chief Market Analyst Chris Beauchamp
Dow Jones, Nasdaq, Hang Seng - Analysis and Charts
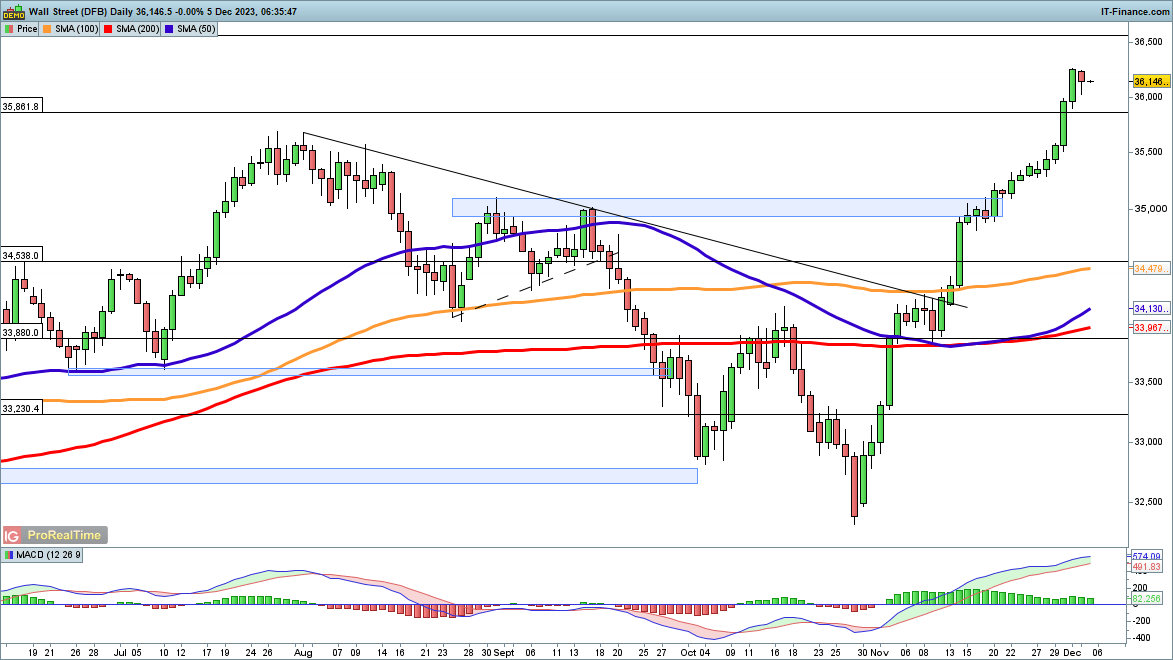
Dow consolidates after surge
Last week saw the index surge to its highest level since January 2022.A 12% gain in the space of a month does arguably leave the index looking vulnerable in the short-term, though for the moment there is little sign of any pullback. A close back below 35,700 might indicate some fresh short-term weakness was developing.
Additional gains cannot be ruled out, and the next level to watch is 36,560, and then to the record high at 36,954.
Dow Jones Daily Chart
Trading is all about confidence - Download our complimentary guide to help you

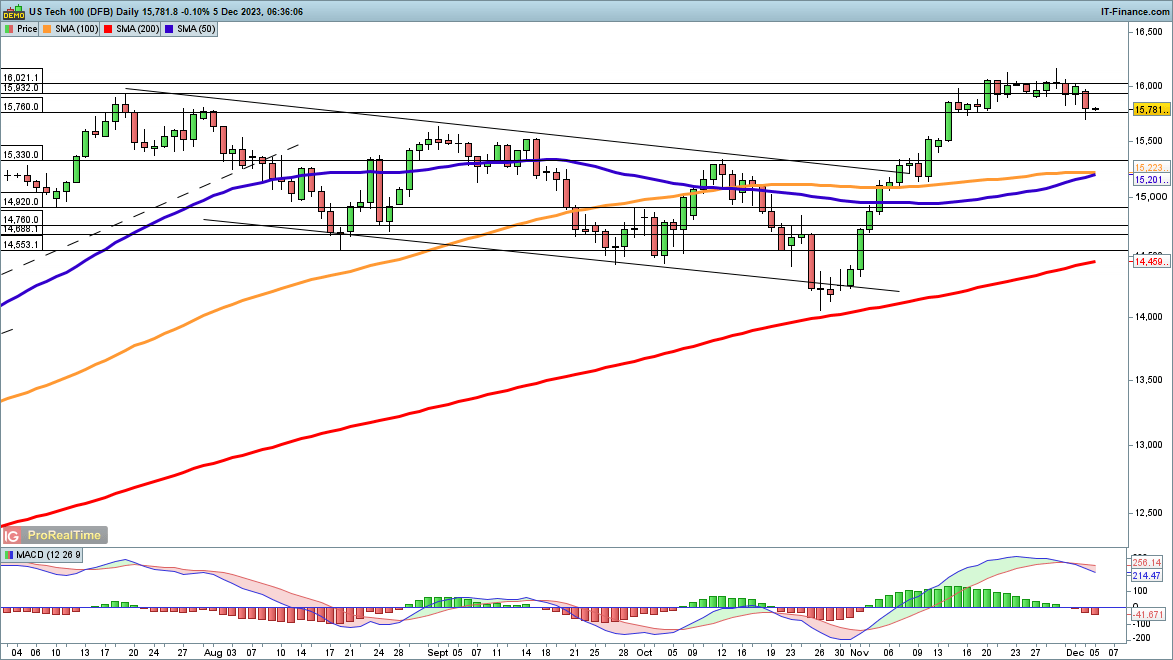
Nasdaq 100 at three-week low
The index briefly hit a three-week low on Monday, continuing to edge back from the recent highs. Further gains seem to have been halted for the time being, and it would need a close back above 16,000 to indicate that a new leg higher had commenced.
In the event of more losses, a drop towards the late August high of around 15,550 may find support.
Nasdaq 100 Daily Chart

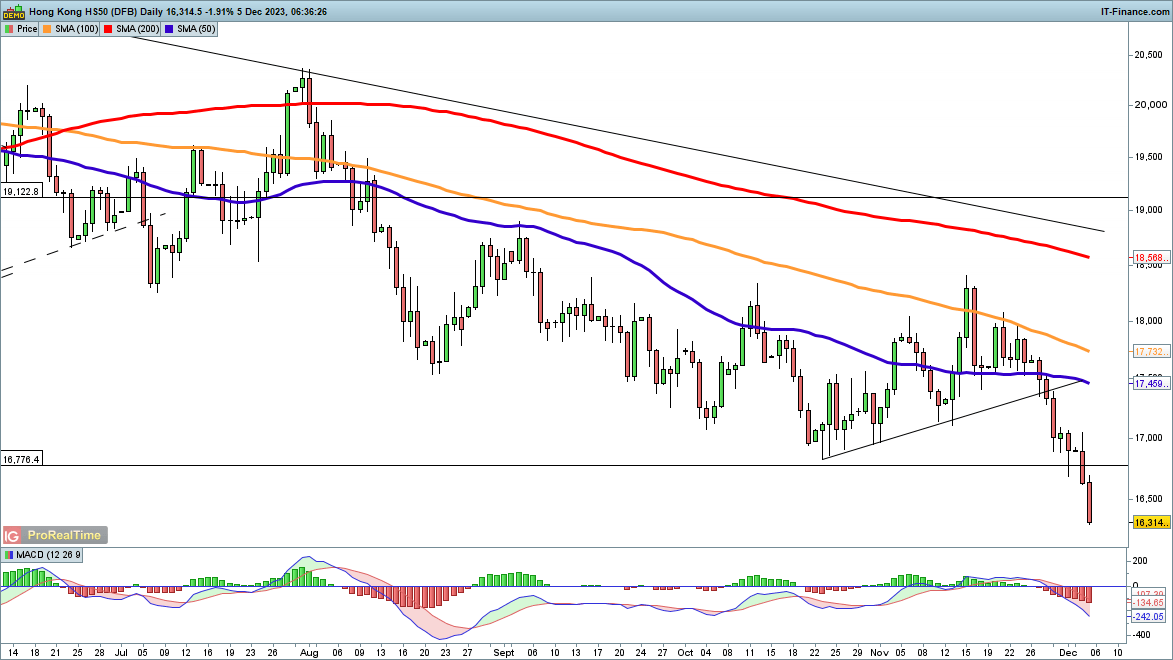
Hang Seng hits a one-year low
Unlike other indices, the Hang Seng has seen its gains from the October low slip away in November. Monday witnessed fresh losses that took the index to its lowest level in thirteen months. A move towards 15,890 now looks likely, with the price continuing to eat into the gains made since the end of October 2022.
In the short-term, a close back above 16,800 might suggest a rebound towards the 50-day SMA has begun.
Hang Seng Daily Chart