


S&P 500, Meme Stocks, Dollar, USDJPY, Fed Funds Rate and RBA Decision Talking Points:
- The Market Perspective: USDJPY Bullish Above 132.00; EURUSD Bearish Below 108
- Market-based rate forecasts have swelled to meet the Fed’s forecasts, lifting the Dollar to notable EURUSD and USDJPY breaks
- Risk trends were noticeably more restrictive Monday, but meme stock troubles may shake the speculative-driven ‘risk on’ mentality

The fundamental aftermath of last week’s calendar is strong, but that doesn’t mean it will continue to drive speculative development through the foreseeable future. With the US Dollar, the combined FOMC hike, nonfarm payrolls beat and service sector activity acceleration has kept the rate forecast charge going through Monday trade. On the other hand, the interest rate implications didn’t seem to carry the same gravitas for risk assets like the US indices. Perhaps that will change when if there is a more direct hit to the core of the retail speculative resurgence – a troubling possibility with some meme stock trouble afterhours. Taking stock of sentiment to start the week, the S&P 500 extended the retreat it kicked off through the end of last week. The incredible head fake that began with the FOMC rate hike (and prominent market discount to their forecast) was followed by the significant beat on the labor and ISM reports through Friday. The volatility through that session was palpable with a 1.0 percent gap lower on the open and the largest upper wick in three months, but SPX was only lower by -1.0 percent by the close. Monday’s -0.6 percent extension on a smaller daily range and noticeably more restrictive volume only adds to that measured perspective. But there is reason to be cautious ahead.
Chart of S&P 500 with Volume, 20 and 200-Day SMA and Gaps (Daily)
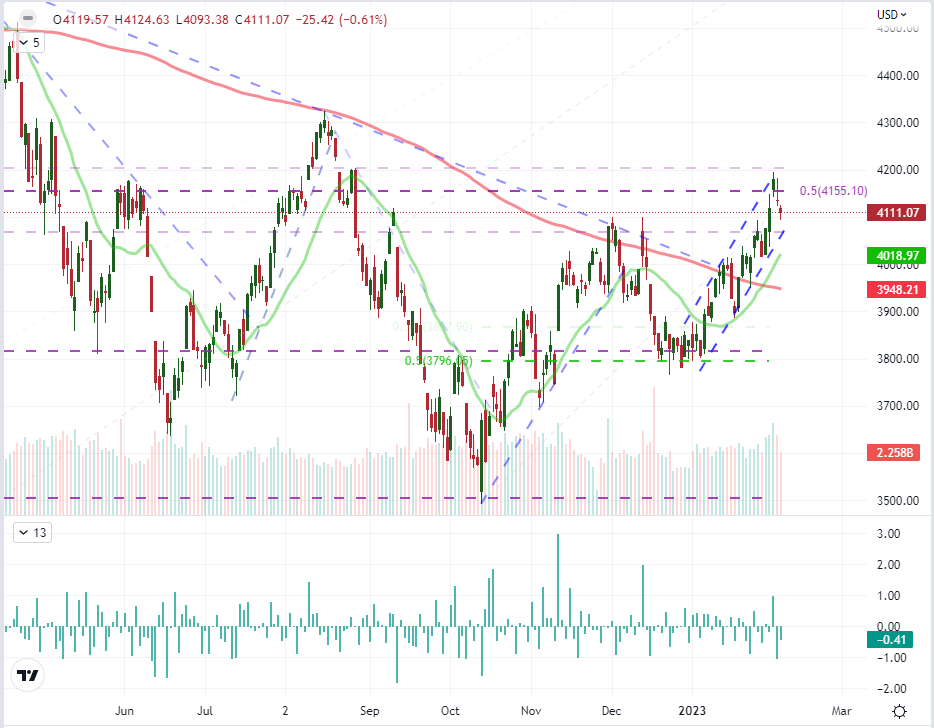
Chart Created on Tradingview Platform
In the market charge that we have seen specifically over the past month (as much as an 11 percent gain for the S&P 500), there has been a particularly uneven fundamental backdrop. Over that period there was a very modest improvement in US growth forecasts (the IMF raised its 2023 outlook 0.4 percentage points to 1.4 percent) and interest rate expectations for the Fed were essentially flat. So where did the markets draw that level of inspiration? It would seem to come from more speculative sources – as opposed by longer duration investors. We can see that in comparisons like the Nasdaq 100 to the Dow index (growth to value), the surge in retail options activity or the deterioration of yield premium for ‘junk’ assets among other measures. Perhaps the most poignant indication though was the surge in a few key meme stocks this past session. AMC shares surged as much as 21 percent and GameStop charged up to 13 percent this past session, but both paled in comparison to the Bed Bath & Beyond explosion to a Monday peak gain of 130 percent over Friday’s close. Yet, in one of the fastest lessons the market has given in some time, the company announced after the close that it intended to raise over $1 billion; and if the effort failed, they could file for bankruptcy.
Chart of Bed Bath and Beyond with Volume and ROC, Overlaid with GameStop and AMC (Daily)
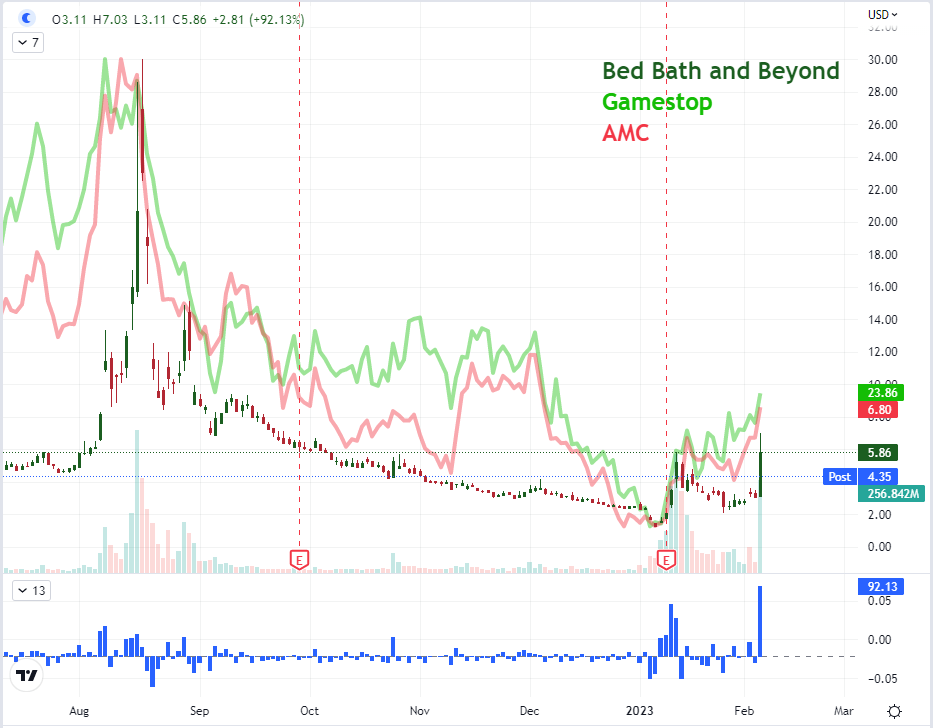
Chart Created on Tradingview Platform
Gauging the course forward with principal fundamental drivers, it is important to evaluate where there is productive development to be found on themes. Through this past session, there was a very clear sustained advance in interest rate expectations behind the US central bank. While the FOMC rate hike last and Fed Chairman rhetoric last week was certainly worth of the attention, it earnestly elicited only the market’s skepticism. It wasn’t really until the combo of the NFPs and ISM Friday that the ‘onus’ of a strong US economy leading to a reasonable belief in the Fed’s commitment that the market really took the outlook seriously. Through this past session, the rate forecast continued to charge with the implied Fed Funds rate through futures through midyear rise to the central bank’s own 5.1 percent target and the year-end discount of rate hike/s dropped from approximately -44 basis points to -24. Now, after the strongest three-day rally for the DXY Dollar Index since the September peak was found and with notable resistance above, what will carry us to the next technical milestone? There isn’t much rate discount to work off from here. But perhaps a more meaningful risk aversion can activate another leg of the Dollar’s appeal.
Chart of DXY Dollar with 50-Day SMA, 3-Day ROC Overlaid with Implied Fed Rate Dec 2023 (Daily)
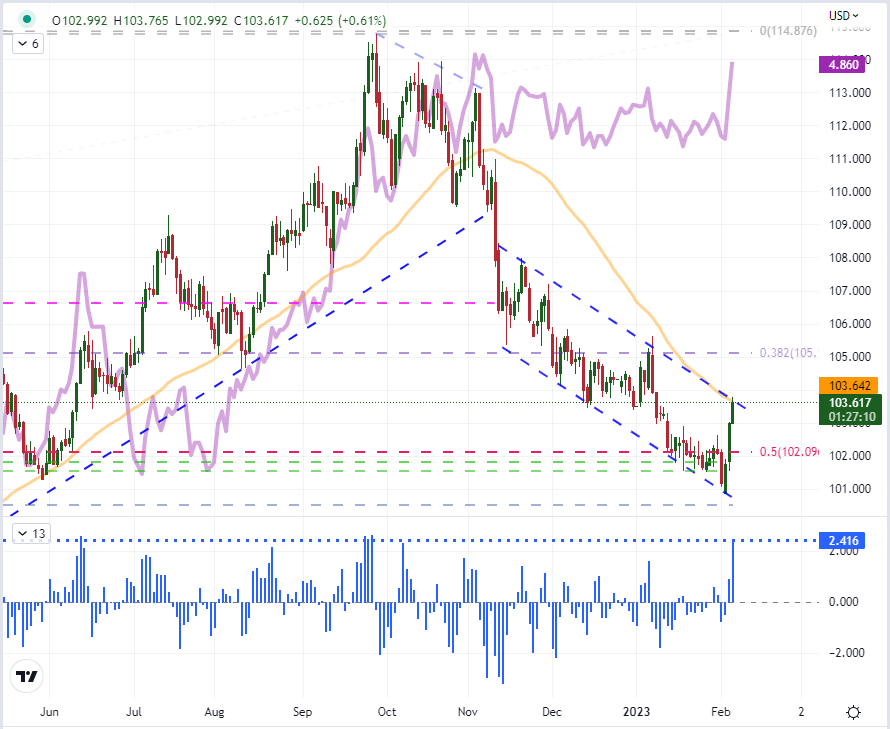
Chart Created by John Kicklighter
Among the Dollar-based crosses that I am watching, to pairs looked particularly notable through Monday’s close. EURUSD dropped the 20-day SMA through the end of last week as well as the floor of the rising wedge formation from November. However, it didn’t really register as a full break. The follow through on Monday however gave it more distinctiveness. There is a 50-day moving average below that pair around 1.0690. That said, I still prefer USDJPY as a more fundamentally charged cross. There is a greater sensitive to interest rate differentials and principally the Fed’s interests are taken more seriously here – though news the BOJ was talking to a well-known dove as Kuroda’s forthcoming replacement added some lift. Risk trends are even more distinctive here as well. I will be watching this pair’s battle with the 38.2 percent Fib of the 2021-2022 range at 133 as the next decision point.
Chart of USDJPY with 20 and 50-Day SMA, Daily Gaps (Daily)
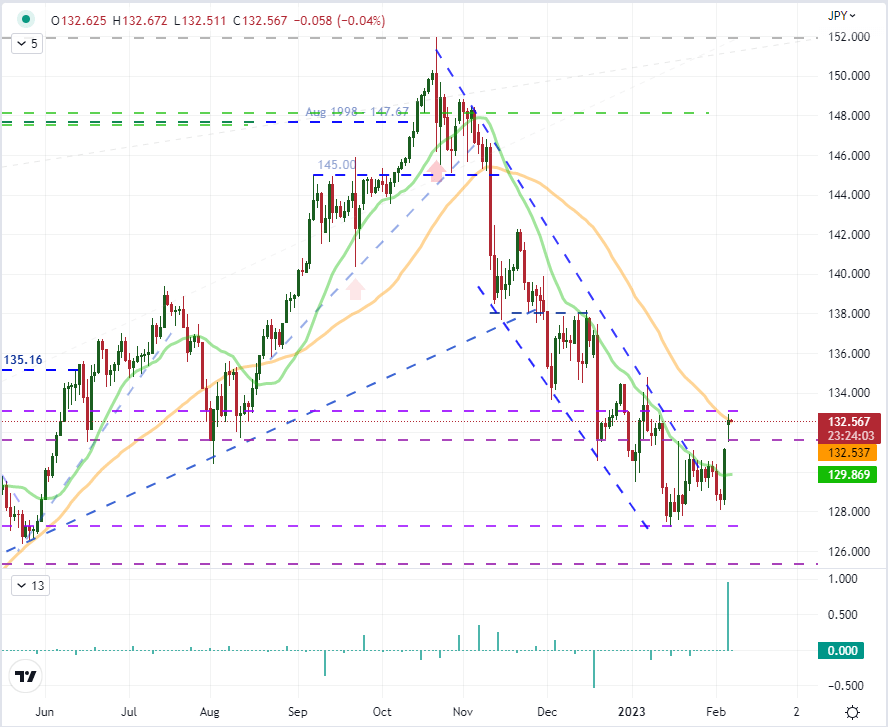
Chart Created on Tradingview Platform
From the scheduled event risk over the next 24 hours, there is a significant volume of updates due; but the weight of the listings is not particularly high. The most potent event for volatility would be the Reserve Bank of Australia (RBA) rate decision. Though there has been a lot of rate tempo oscillation this past week, the Australian group had cooled its outlook a few months back. That could very well change if the group picks up some of the worry the Fed has adopted over inflation, but that seems an outlier outcome. Fed Chairman Powell’s remarks are not likely to be much different than the rhetoric he has offered previously, but the market seems to be particularly sensitive to US rate forecasting which may change the response cadence.
Top Global Macro Economic Event Risk for the Next 24 Hours
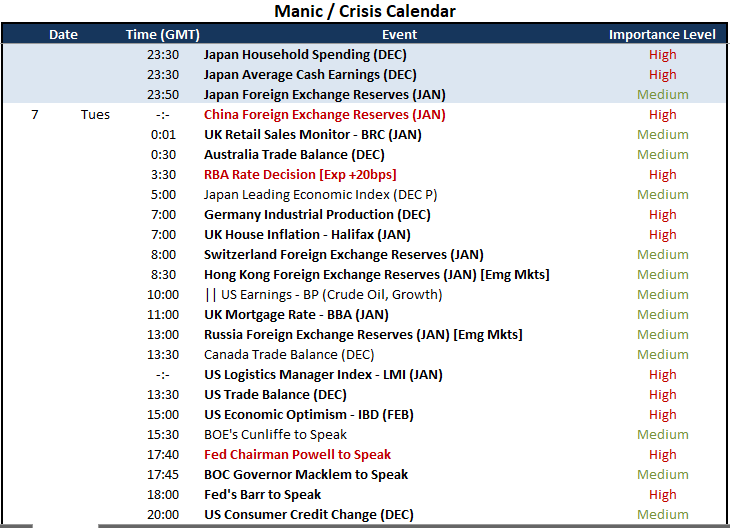
Calendar Created by John Kicklighter


