


Silver Talking Points:
- Silver set a fresh seven-month-high on Friday, finding resistance at a key Fibonacci level after a significant support test at a confluent spot last week.
- While Gold prices led Silver prices higher for the first eight months of the year, a noticeable shift has taken place since the September open.
- The analysis contained in article relies on price action and chart formations. To learn more about price action or chart patterns, check out our DailyFX Education section.

Silver prices set a fresh seven-month-high on Friday, finding resistance at a key Fibonacci level that plots at the price of 23.88. This is the 50% mark of the 2020-2022 sell-off and there’s also some prior price action reference, as this same level had helped to set a swing low a couple of years ago.
I had looked into Silver prices last week, highlighting a long-term zone of support that ended up helping to carve out last week’s lows. This runs from the 21.73 area up to around 22.35, and this was an area of support through 2021 trade until coming in as resistance in May and then again in November, just before prices staged a breakout to the fresh seven-month-highs that printed last week.
Silver Weekly Price Chart
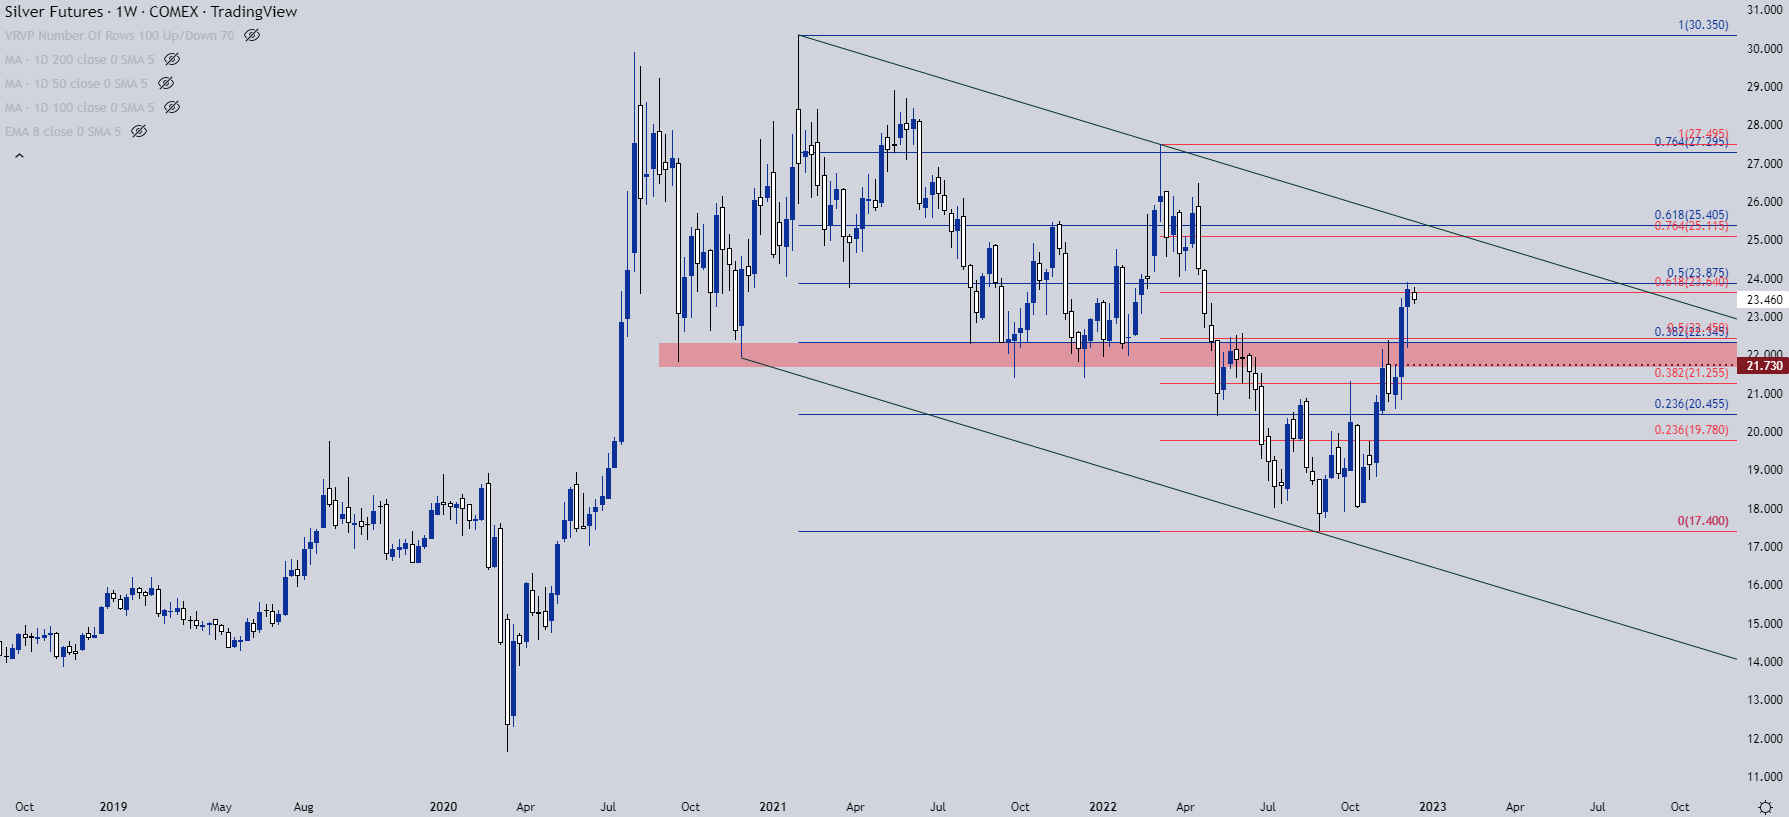
Chart prepared by James Stanley; Silver on Tradingview
From the daily, we can see that support pullback that showed up last week, with the lows carving out around the 38.2% Fibonacci retracement of the same major move from which the 50% marker set the highs. There’s some additional reference here, as well, taken from the Fibonacci retracement covering the 2022 major move, from the high set in March down the same September low that was helping to set the prior retracement.
This highlights another level of resistance that’s at-play, taken from around 23.64 and collectively, with the 23.88 level, this creates a resistance zone that buyers will have to contend with if the breakout is to continue. But, a recent higher-high combined with last week’s higher-low keeps the door open for bulls.

Silver Daily Chart
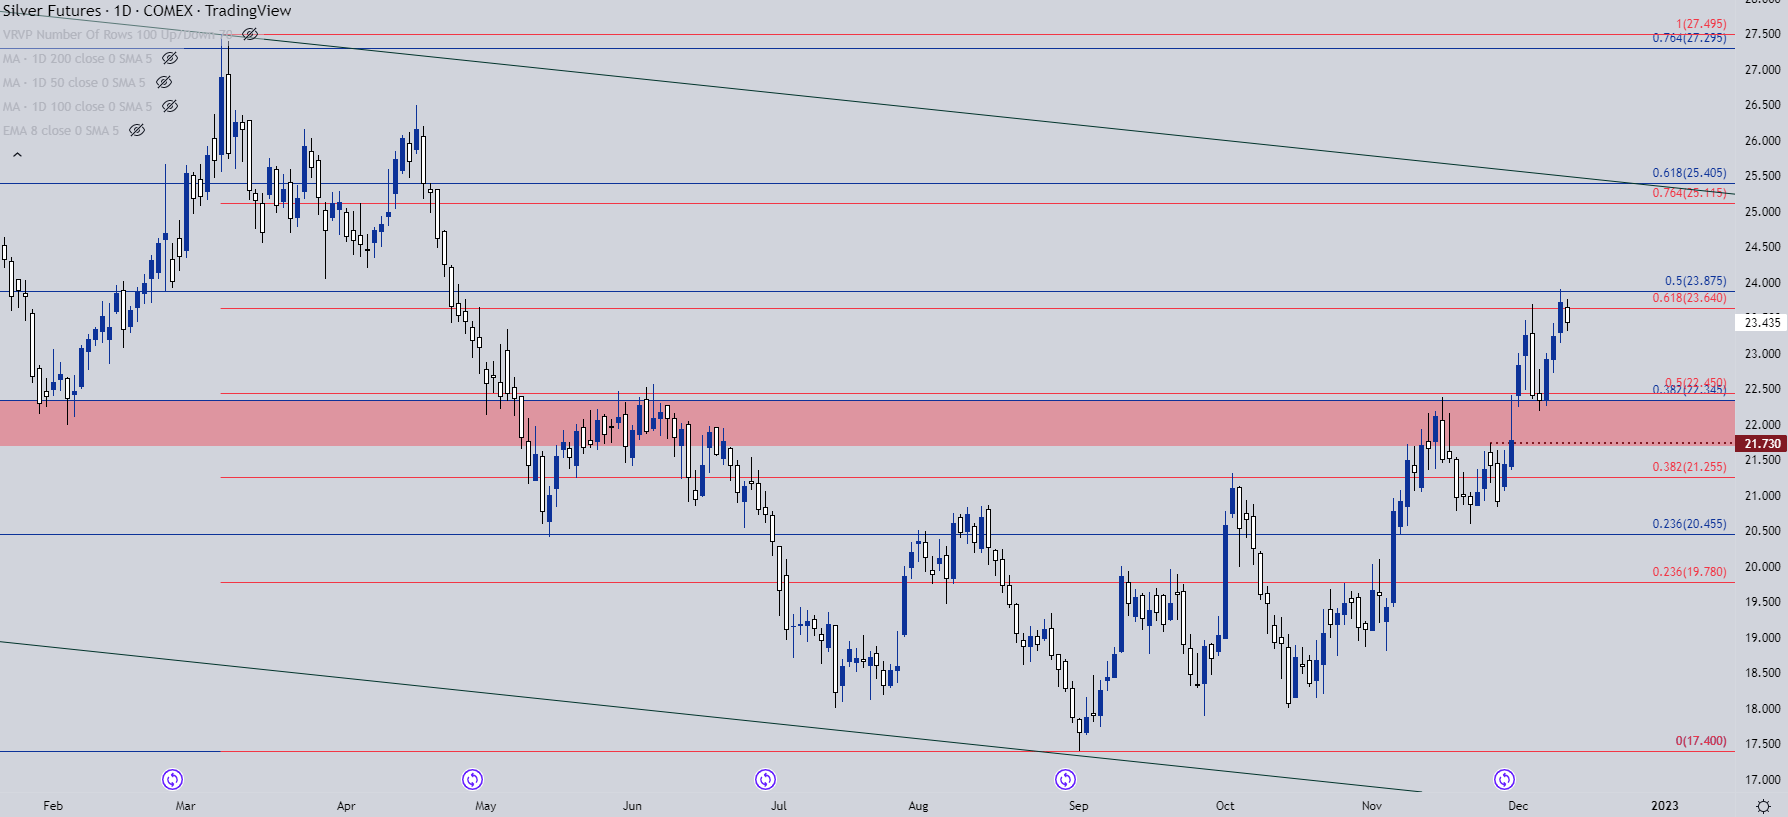
Chart prepared by James Stanley; Silver on Tradingview
Silver Shorter-Term
Silver carries bullish potential given the recent higher-high to go along with a higher-low, but the big question is where that next higher-low might appear.
Last week’s swing-low is at 22.19, so buyers will need to step-in to offer support above that price. From recent price action, there’s some potential for such around the 23 handle, running up to around 23.14 which was last Friday’s swing-low just before the push up to Fibonacci resistance.

Silver Four-Hour Chart
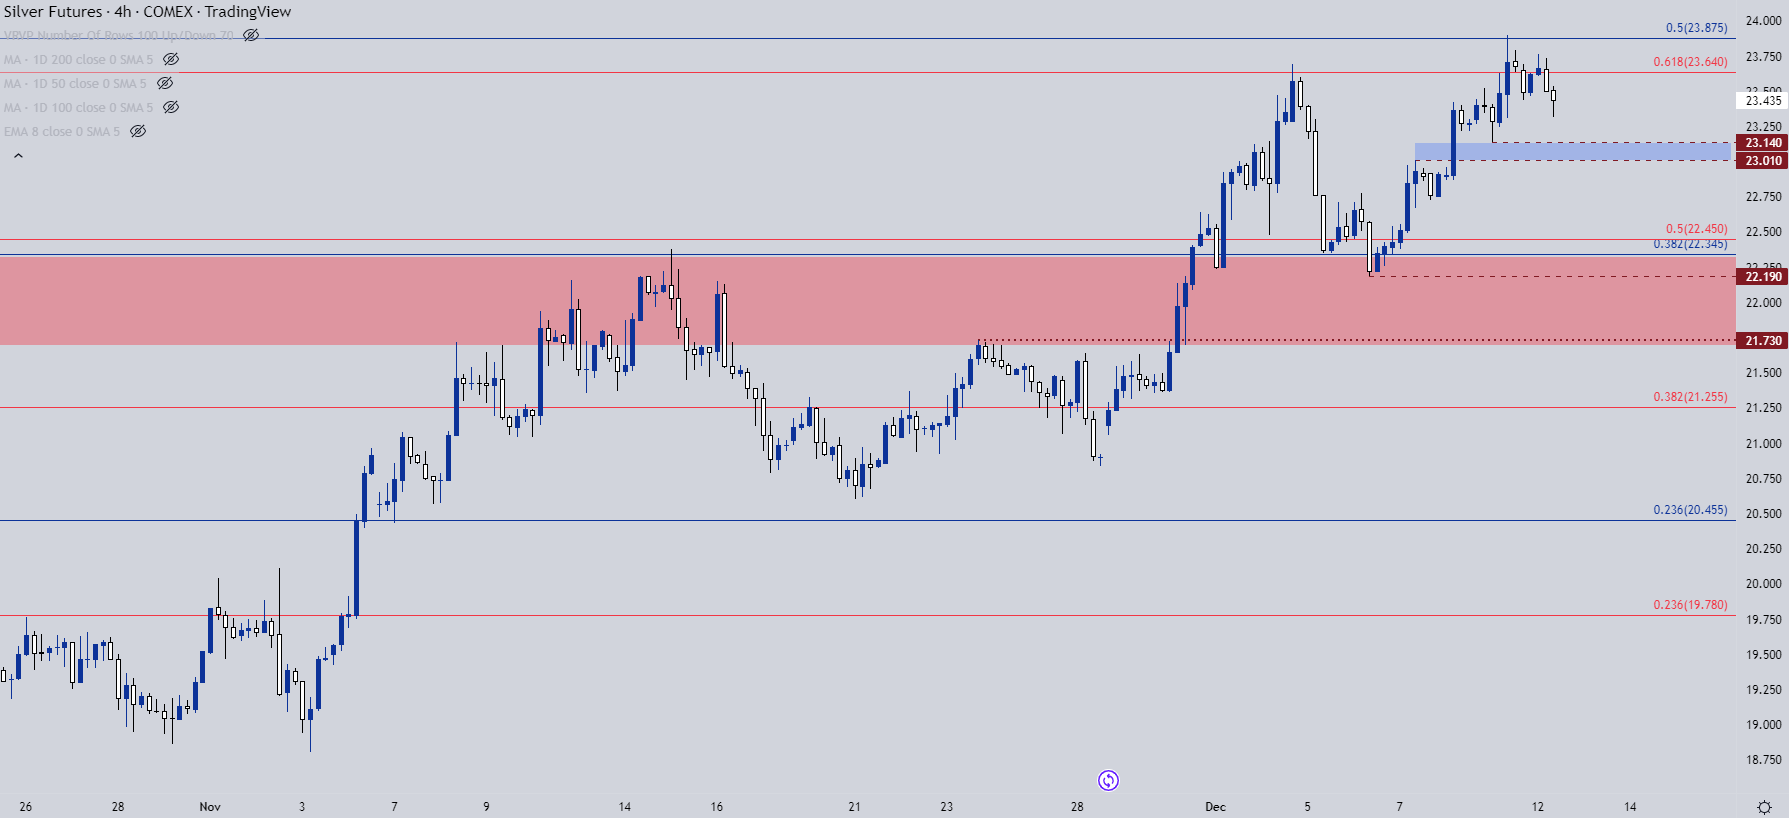
Chart prepared by James Stanley; Silver on Tradingview
--- Written by James Stanley, Senior Strategist, DailyFX.com & Head of DailyFX Education
Contact and follow James on Twitter: @JStanleyFX


