


- Precious metals were on a strong run last week, with Gold prices setting a fresh three month high and Silver setting a fresh seven month high.
- Gold found resistance at a key spot looked at last week which then led to pullback, and the pullback in Silver is now attempting to hold support at prior resistance.
- The analysis contained in article relies on price action and chart formations. To learn more about price action or chart patterns, check out our DailyFX Education section.

Precious metals have pulled back after strong breakouts last week. The bullish move in Gold started in early-November. Bears had an open door to work a breakdown but were continually caught at support around 1628 through the month of October, allowing for the build of a falling wedge formation.
I looked into this on the first day of last month highlighting bullish reversal potential, and that theme ran all the way into yesterday’s trade at which point a fresh three-month-high appeared around the same zone of resistance that was in-play to catch the highs in August.
Interestingly Silver may have a more bullish backdrop here as the low in Silver was set in early-September and last week saw price jump above a massive area of prior resistance, which is now showing up as short-term support. The move off of that September low in Silver has ran as high as 36.15%, compared to the bullish move in Gold from the November lows at a more modest but still respectable 12.64%. Below, I parse through each.
Gold
The breakout in Gold hit early last month as price breached through the top of a falling wedge pattern. Falling wedges are often tracked with the aim of bullish reversals and as that bullish breakout soon led in to a short-term trend, with a continuation of higher-highs and lows during last month’s trade.
I had looked into Gold last Tuesday, highlighting the continued build of higher-low support. I had also marked a resistance area around the 1819-1824 area, which was the zone that caught the highs in August. This zone came into play on Thursday morning, just after the release of PCE data, and it held the high through the end of the week.
Yesterday morning saw another attempt to breakout beyond that resistance but similarly that failed and prices have pulled back, and that pullback yesterday following the failed breakout was sizable as price pushed below the support zone taken from prior resistance, plotted at the 1785-1791 level.
Gold Daily Price Chart
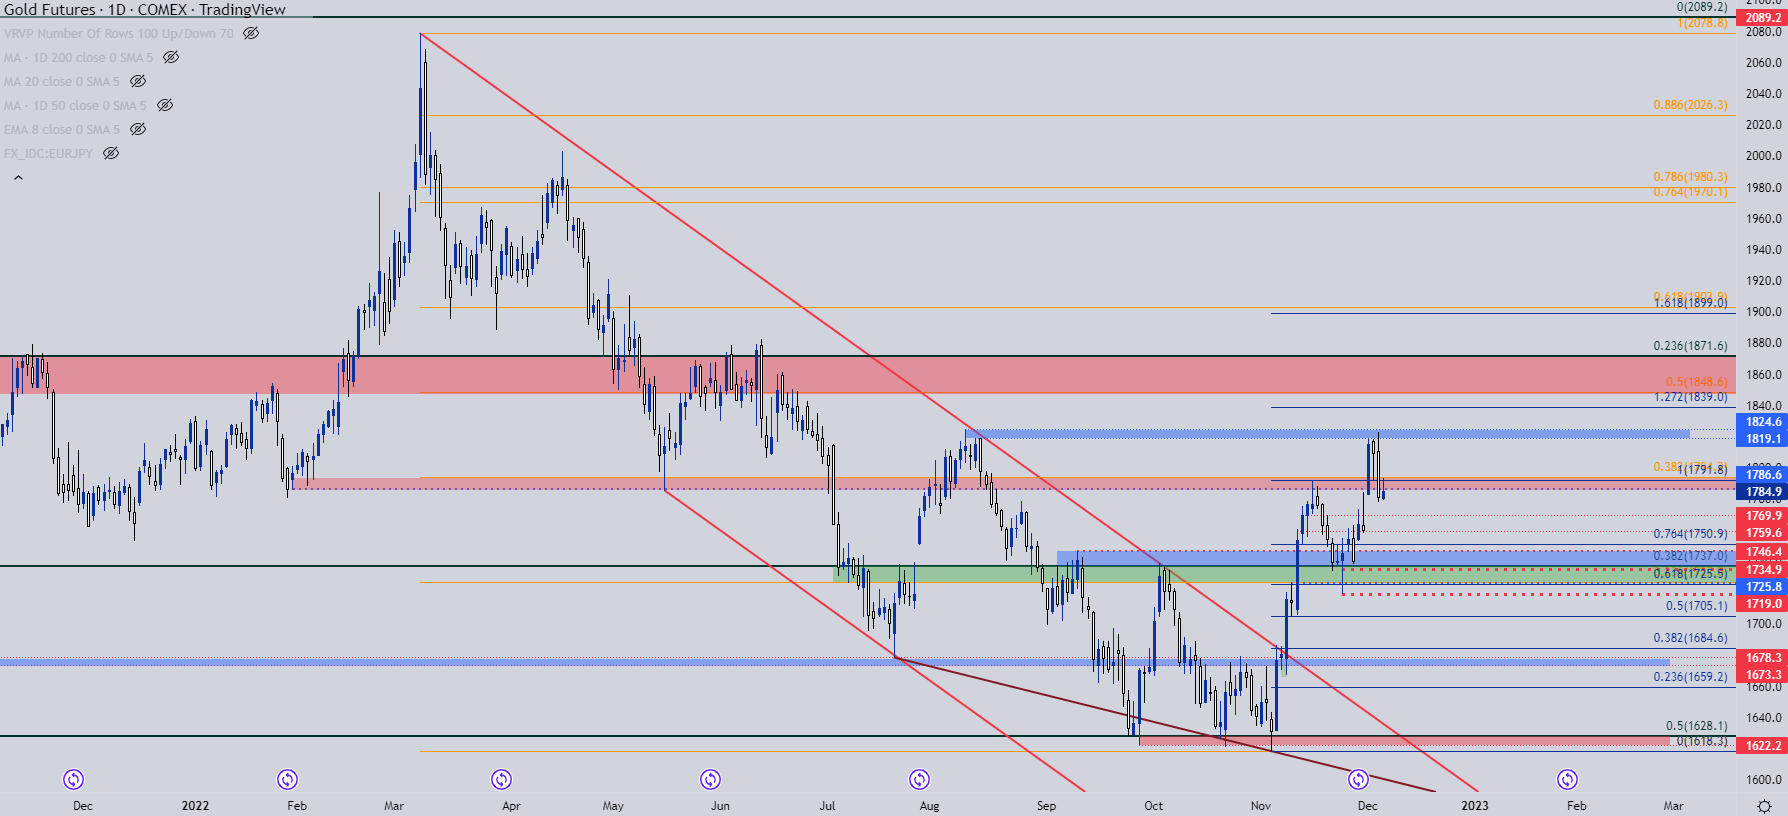
Chart prepared by James Stanley; Gold on Tradingview
Gold Shorter-Term
On the below four-hour chart, we can see where yesterday’s failed breakout sunk below the support zone as taken from prior resistance. The level of 1791 remains pertinent as this was a swing-high earlier in November that set a bit of short-term support last Friday, right around the release of NFP data. But, it was unable to hold the lows yesterday as prices were pulling back and already on the morning it’s started to show again as short-term resistance.
This opens the door for short-term bearish themes with focus on the same set of levels that was in-play when prices were working higher last month. The next spot of support that I’m tracking is around 1770 and if sellers can evoke a push there, then we’d have a lower-low to go along with a lower-high. At that point, there’s greater confirmation of deeper pullback potential, and that can keep the door open for a revisit of the big zone of support that caught the lows last month around the 1737 level.
That short-term bearish theme comes into question if prices push above 1791 and if buyers can extend the move above the 1800 psychological level, bullish scenarios begin to come back into the picture.

Gold Two-Hour Price Chart
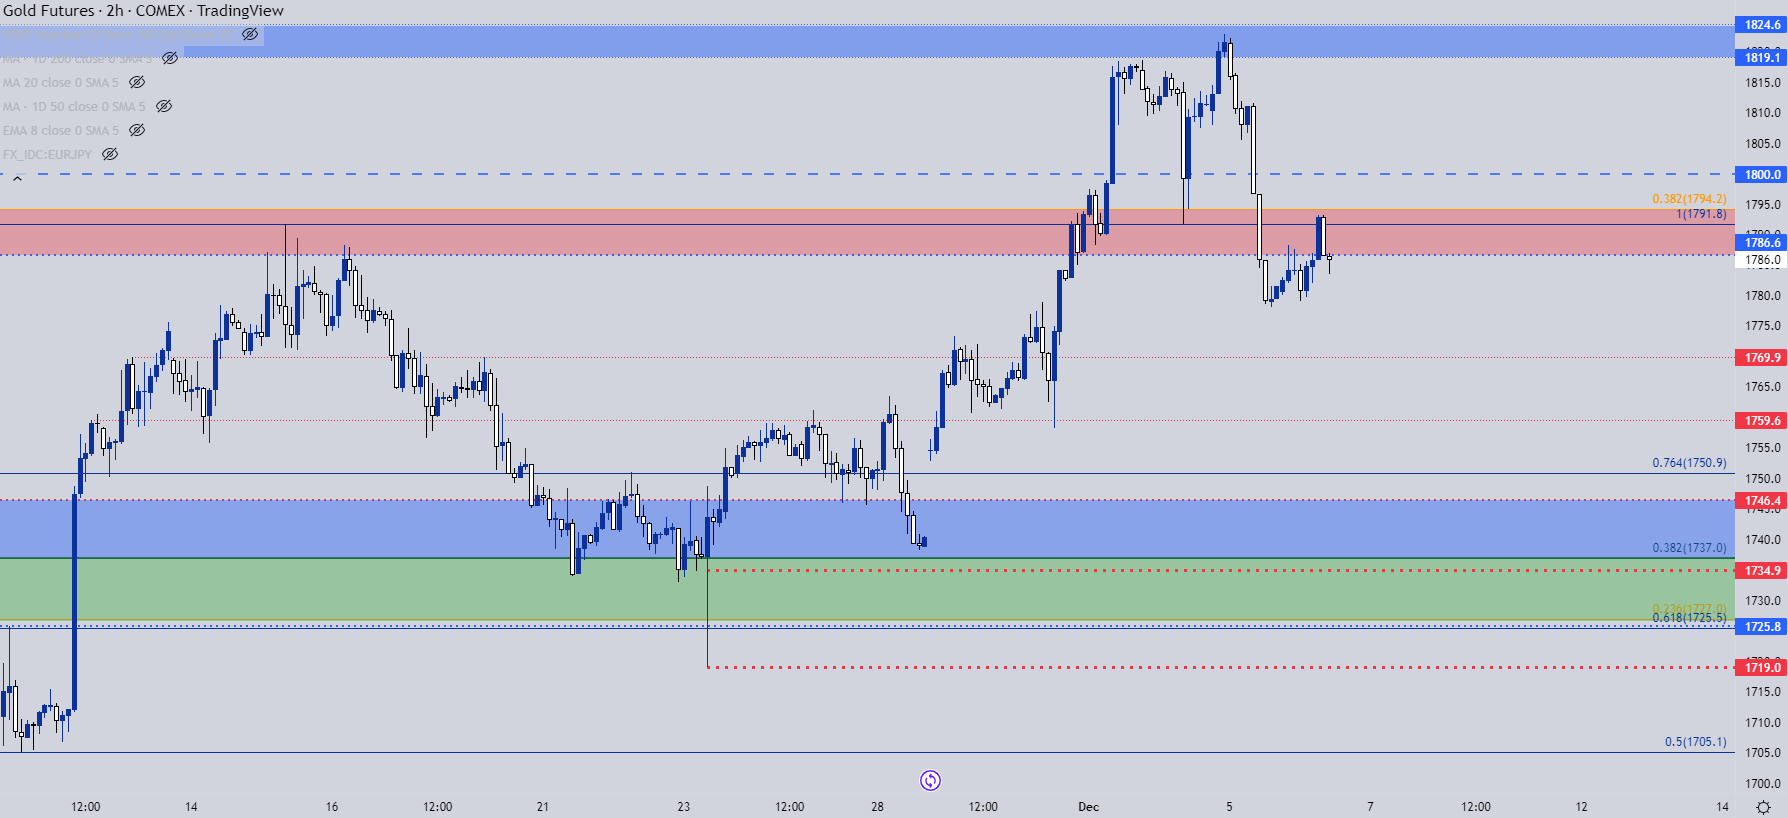
Chart prepared by James Stanley; Gold on Tradingview
Silver
For much of this year Silver has really seemed to struggle with recovery themes. In May, Silver prices broke-below a support zone that had held the lows since late 2020 trade, around the $22-22.50 zone. That decline ran all the way into September trade until eventually a fresh low was set. And through much of October trade, bulls didn’t exactly light the world on fire as prices hung out below that longer-term zone of resistance taken from prior support.
But, bulls started to show more life in November and last week in particular as prices finally broke back-above that key spot of resistance. On the below chart, the current support zone is marked by an area of confluent Fibonacci levels at 22.35 and 22.45.
Silver Weekly Chart
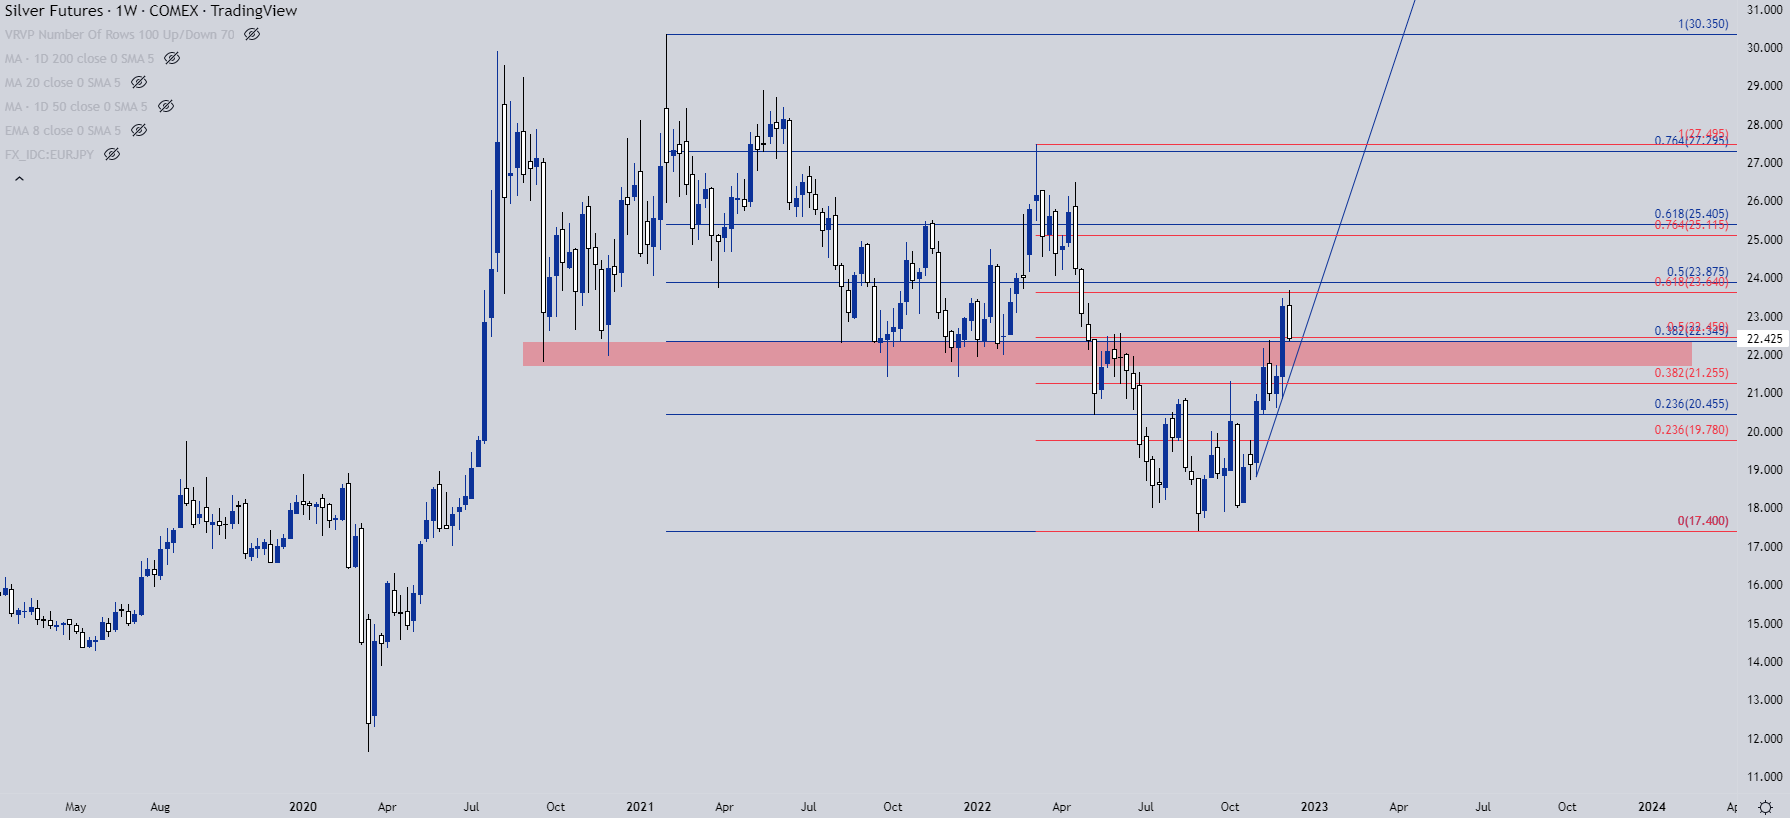
Chart prepared by James Stanley; Silver on Tradingview
From the daily chart, we can see that confluent area coming in to help hold the lows yesterday, and this is the same zone that marked resistance twice last month, on November 15th and again on the 30th.
The pace of gains has been respectable as a bullish channel has guided prices higher and this also highlights how even a deeper pullback may allow for bulls to stay on track, with the bottom of that formation projected to around 21.73. If bulls can hold the lows above that level, the door can remain open to topside scenarios in Silver.

Silver Daily Chart
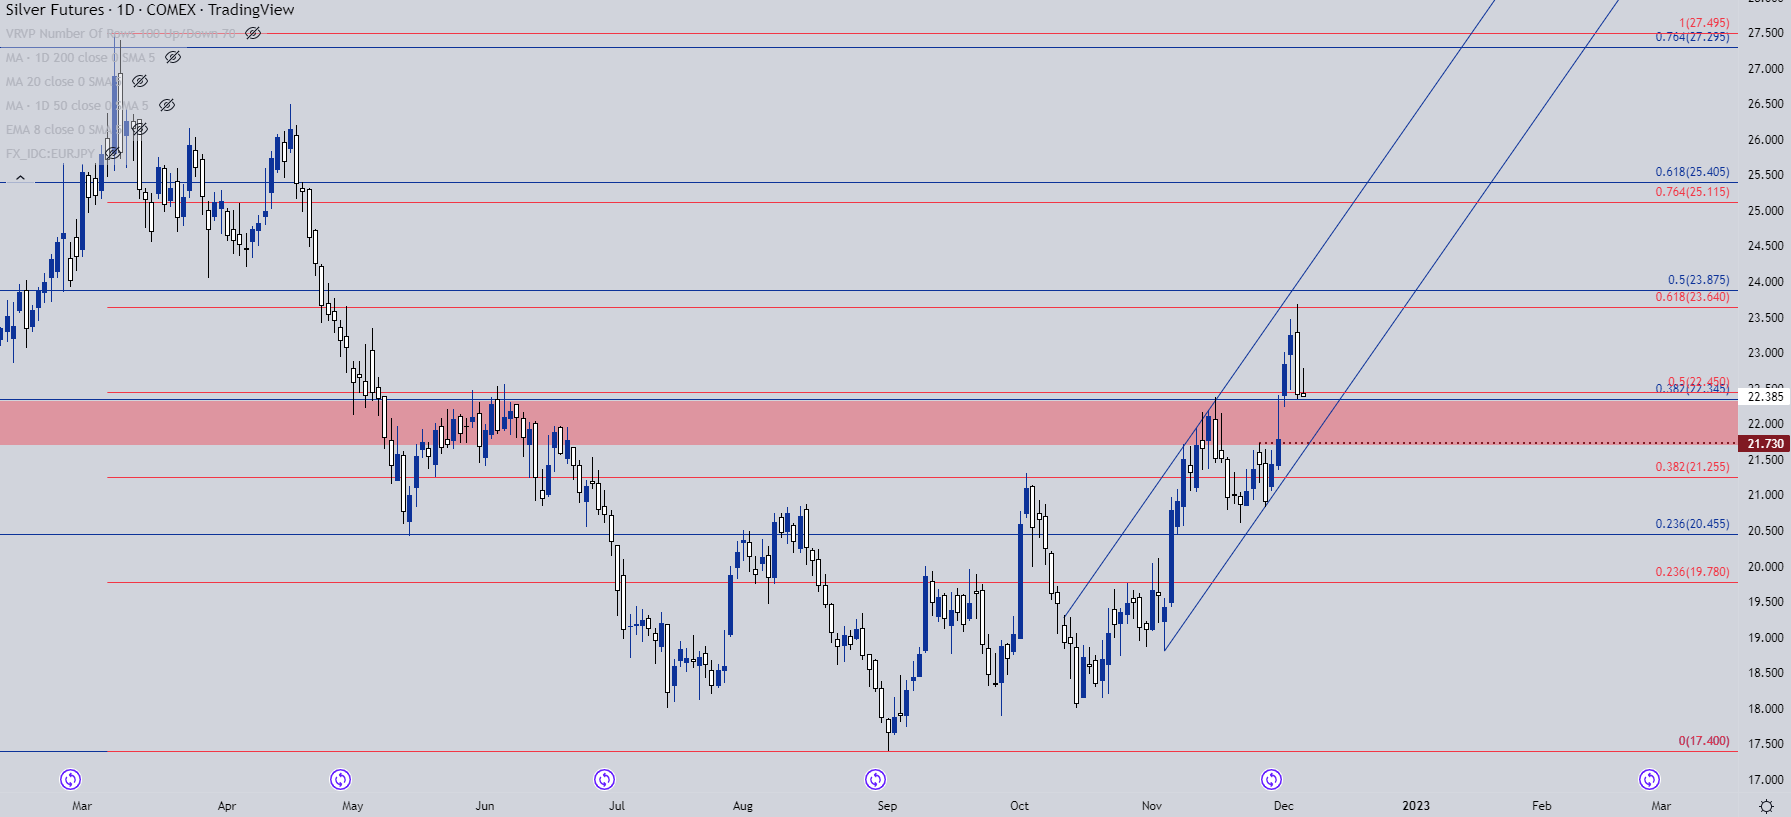
Chart prepared by James Stanley; Silver on Tradingview
--- Written by James Stanley, Senior Strategist, DailyFX.com & Head of DailyFX Education
Contact and follow James on Twitter: @JStanleyFX


