

Bitcoin (BTC/USD) Technical Outlook:
- Bitcoin prices trade sideways as bulls and bears grapple with key technical levels
- BTC/USD indecisive after weekly CCI rises into overbought territory
- Support and resistance forms around the September high of $22,781

Bitcoin prices are currently trading over 36% higher for the month of Jan, buoyed by renewed optimism surrounding the speculative asset. As fears of FTX contagion and higher interest rates subside, the sharp rebound in BTC/USD drove prices higher before stabilizing above $22,000.
Although recession fears and monetary policy remain at the forefront of risk sentiment, technical levels have assisted in driving the recovery.
On the weekly chart below, the strong rebound that has lifted Bitcoin to levels last tested in September last year has driven the CCI (commodity channel index) into overbought territory. With the current weekly candle showing little movement, the potential formation of a doji candle around $22,781 suggests that bulls may be losing steam.
Bitcoin (BTC/USD) Weekly Chart
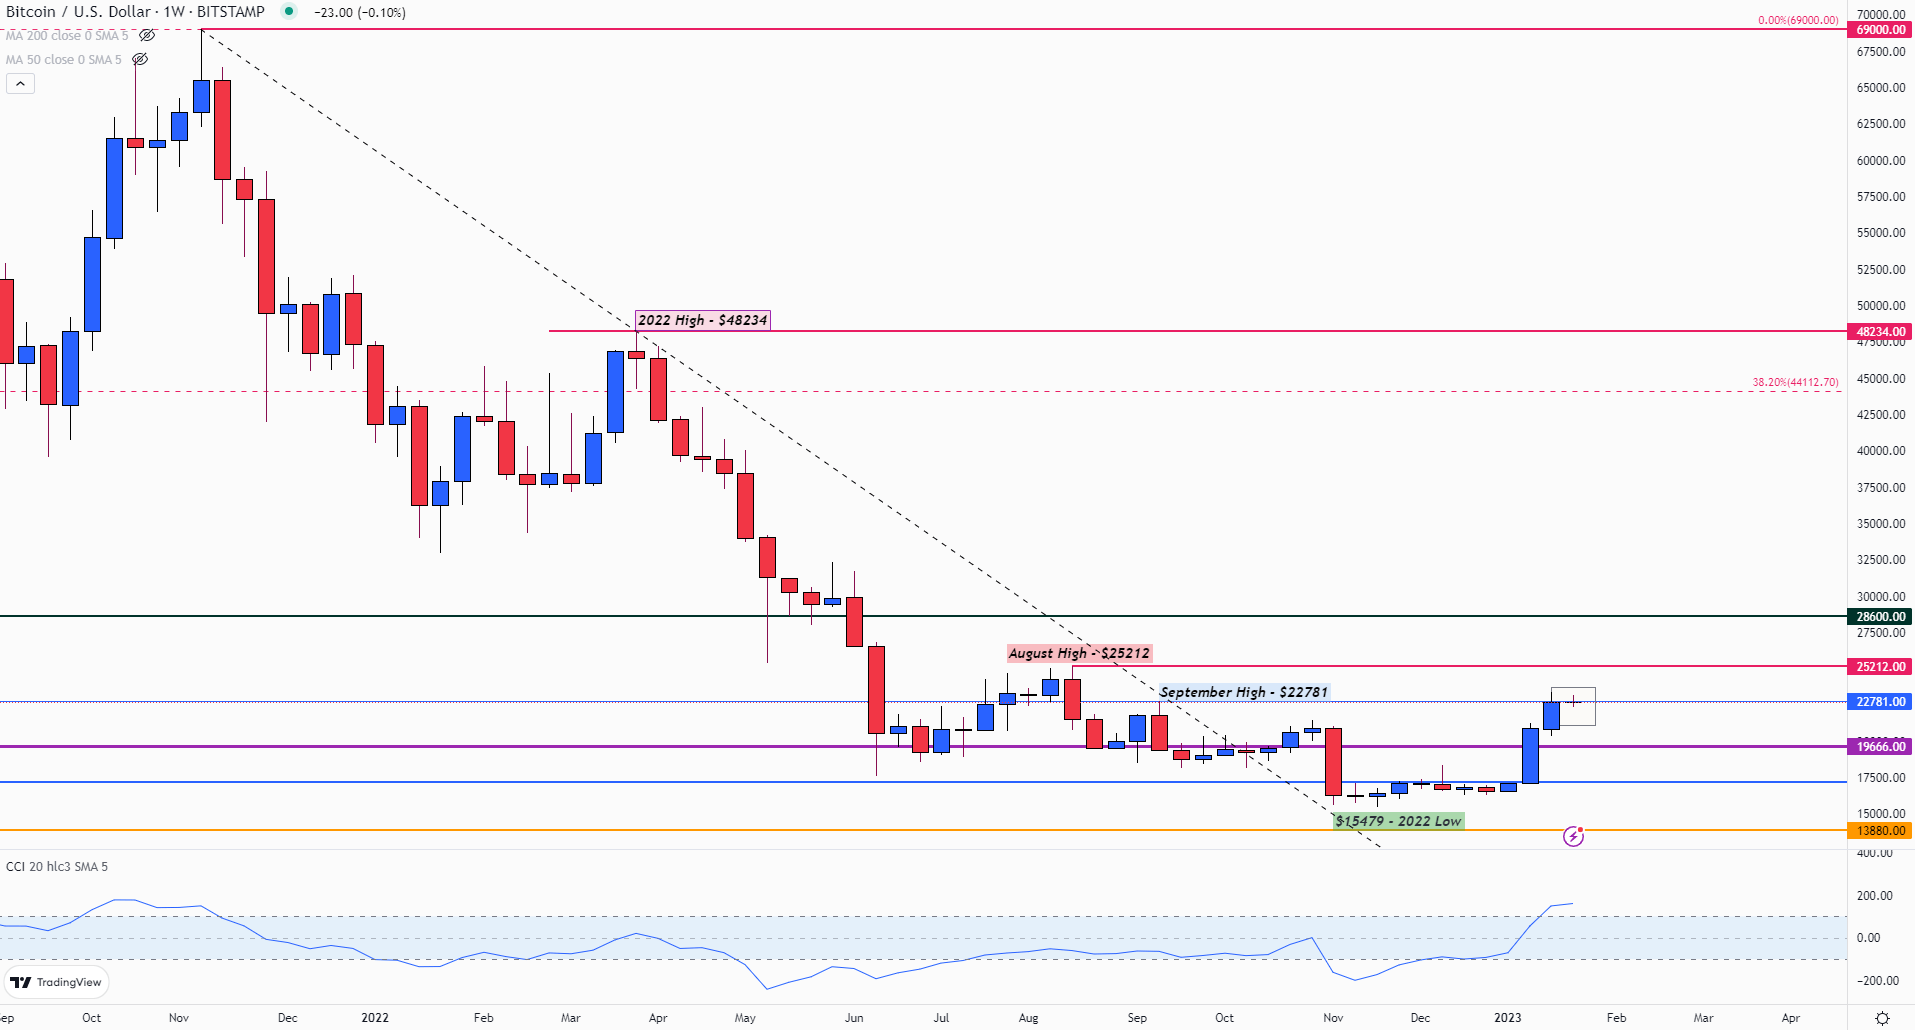
Chart prepared by Tammy Da Costa using TradingView
After reaching a high of $23,362 early last week, a slowdown in bullish momentum drove prices back towards the September high of $22,781. With support at prior resistance, a break in either direction could help determine Bitcoin’s next big move.

Although prices currently remain above both the 50 and 200-day MA (moving average), the daily chart below highlights the way in which the $22,871 handle has restricted gains. Meanwhile, the 78.6% Fibonacci retracement level of the August - November 2022 move has formed an additional barrier of resistance around $23,129.
Bitcoin (BTC/USD) Daily Chart
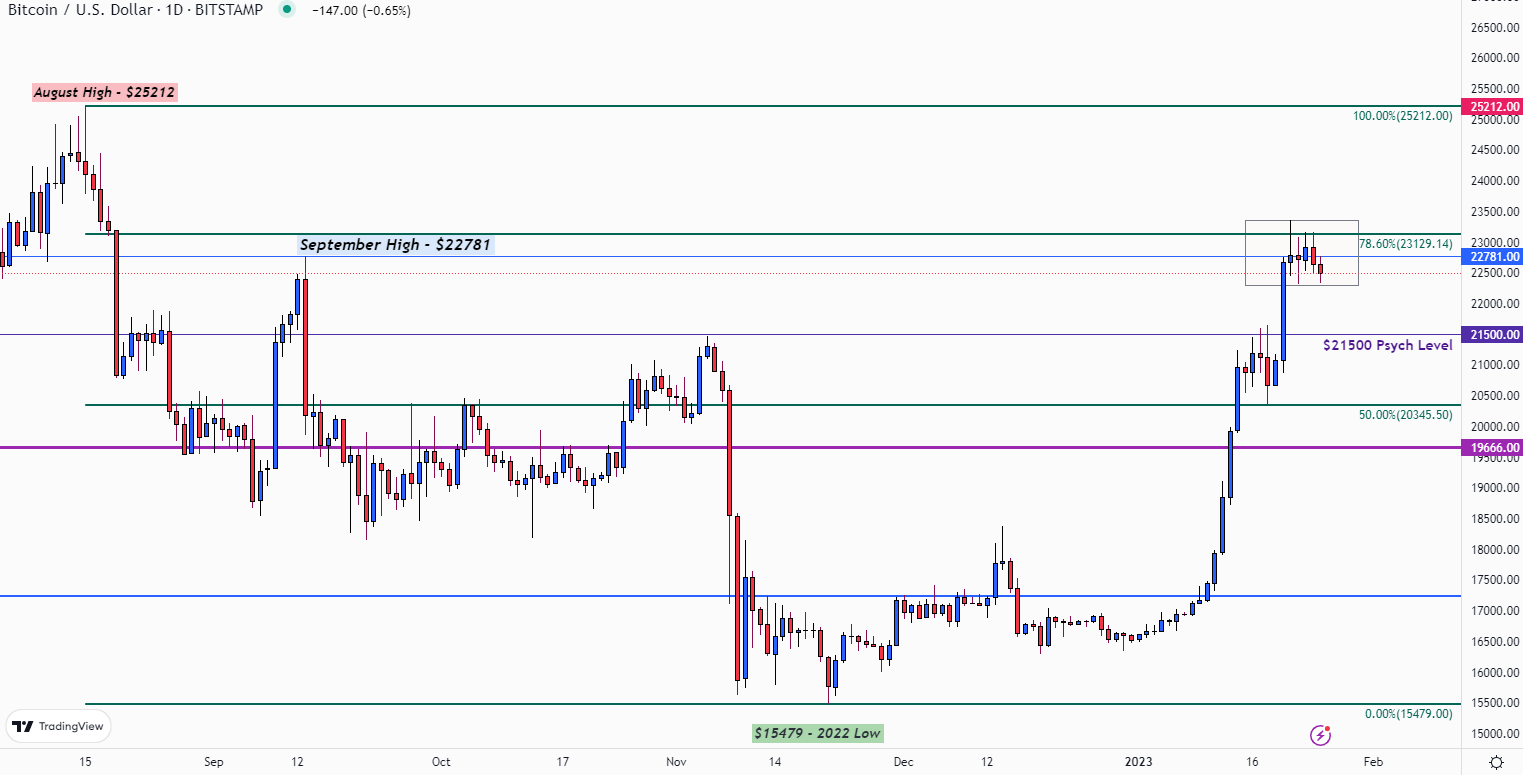
Chart prepared by Tammy Da Costa using TradingView
For bullish continuation to be possible, a clear break of the above-mentioned levels of resistance could reignite bullish momentum, driving BTC towards the August high at $25,212.
However, if bears exert pressure and force prices lower, an increase in selling pressure below $21,500 could bring the December 2017 high back into play at $19,666.
Bitcoin Price Levels Ahead
| Support | Resistance |
|---|---|
| 21,473 (November high) | 22,781 (September high) |
| 20,500 (Psychological Resistance) | 24,739 (200-week MA) |
| 19,666 (2017 High) | 25,212 (August High) |
Bitcoin Further Reading:
- What is Bitcoin? Understanding Bitcoin as a Cryptocurrency
- New to Bitcoin? Read how to start trading cryptocurrency guide
- Learn how to day trade Bitcoin & other major crypto
--- Written by Tammy Da Costa, Analyst for DailyFX.com
Contact and follow Tammy on Twitter: @Tams707