

Bitcoin, BTC/USD, Ethereum, ETH/USD - Technical Outlook:
- Longer-term charts highlight the weakness in Bitcoin and Ethereum.
- BTC/USD and ETH/USD have broken below key support.
- What is the outlook and what are the key levels to watch?

Bitcoin and Ethereum have broken below key support after the US Federal Reserve left interest unchanged on Wednesday but signaled higher interest rates by the end of this year.
At the press conference following the two-day FOMC meeting, Fed Chair Jerome Powell said he doesn’t see a rate cut until inflation comes down meaningfully and significantly, which could take a couple of years. Moreover, the Fed’s June dot plot, an outlook for rate policy, indicated additional interest rate hikes are in the pipeline.
BTC/USD Daily Chart
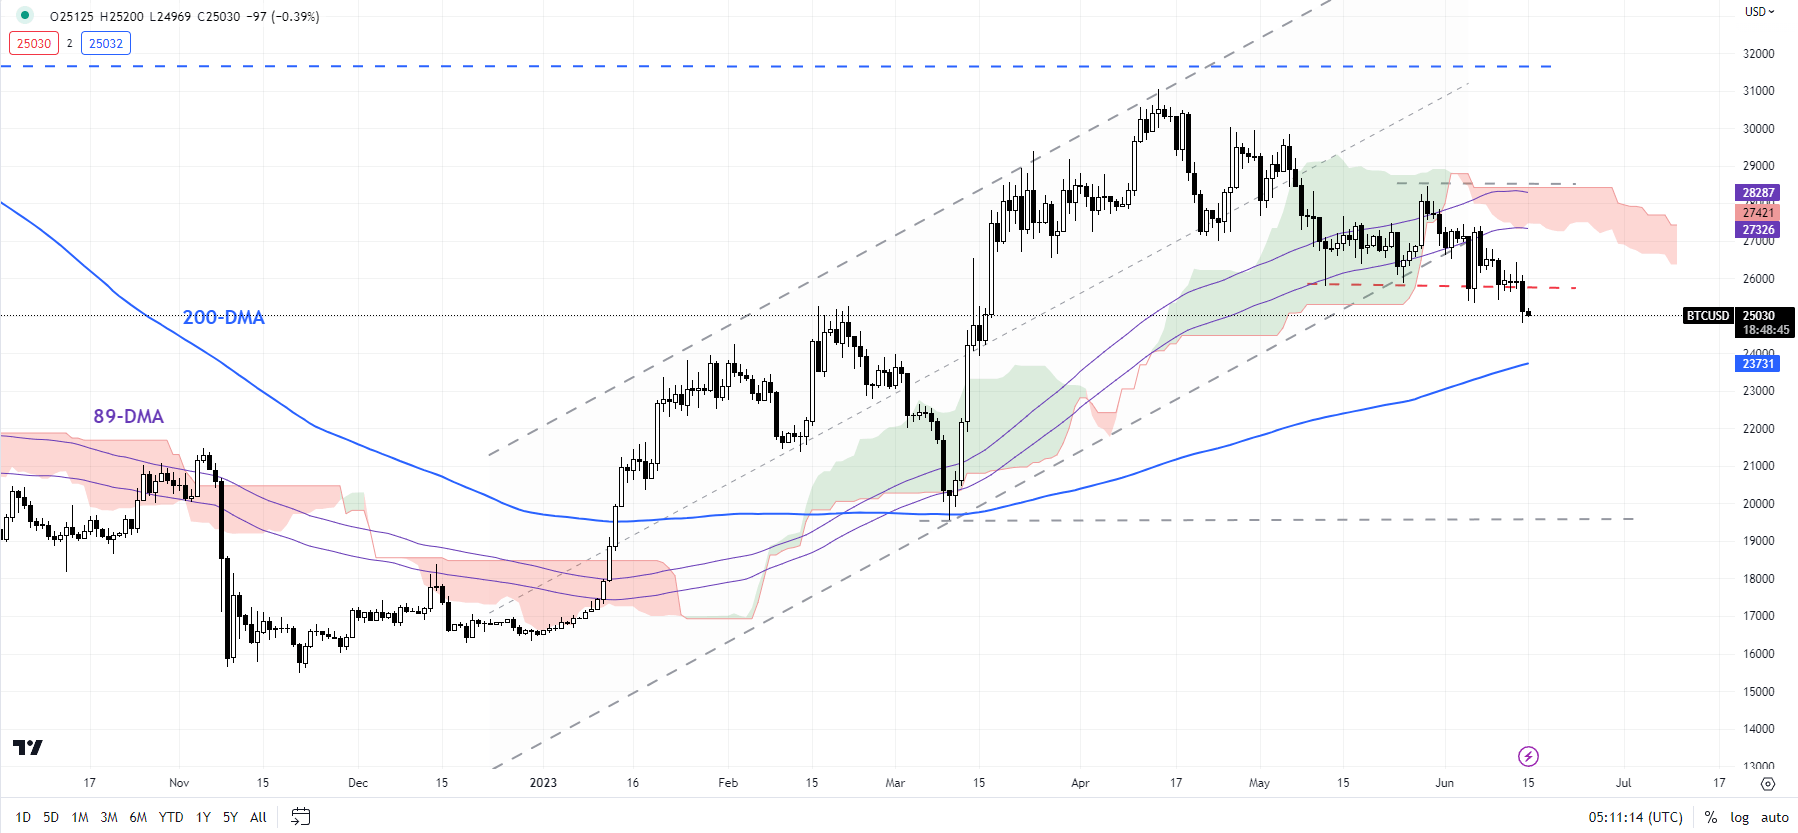
Chart Created by Manish Jaradi Using TradingView
BITCOIN: Cracks below support
BTC/USD’s fall below the mid-May low of 25785 has opened the door initially toward the 200-day moving average (now at about 23700). There is major support at the March low of 19540 – this support needs to give way for the medium-term downtrend to resume. This follows a failure to regain the 30000 mark in May, accentuating downside risks – highlighted early-May “Bitcoin & Ethereum Price Action: Is the Rally Over?” published May 8, and “Bitcoin & Ethereum Week Ahead: Cracks in the Rally?”, published May 15.
BTC/USD Monthly Chart
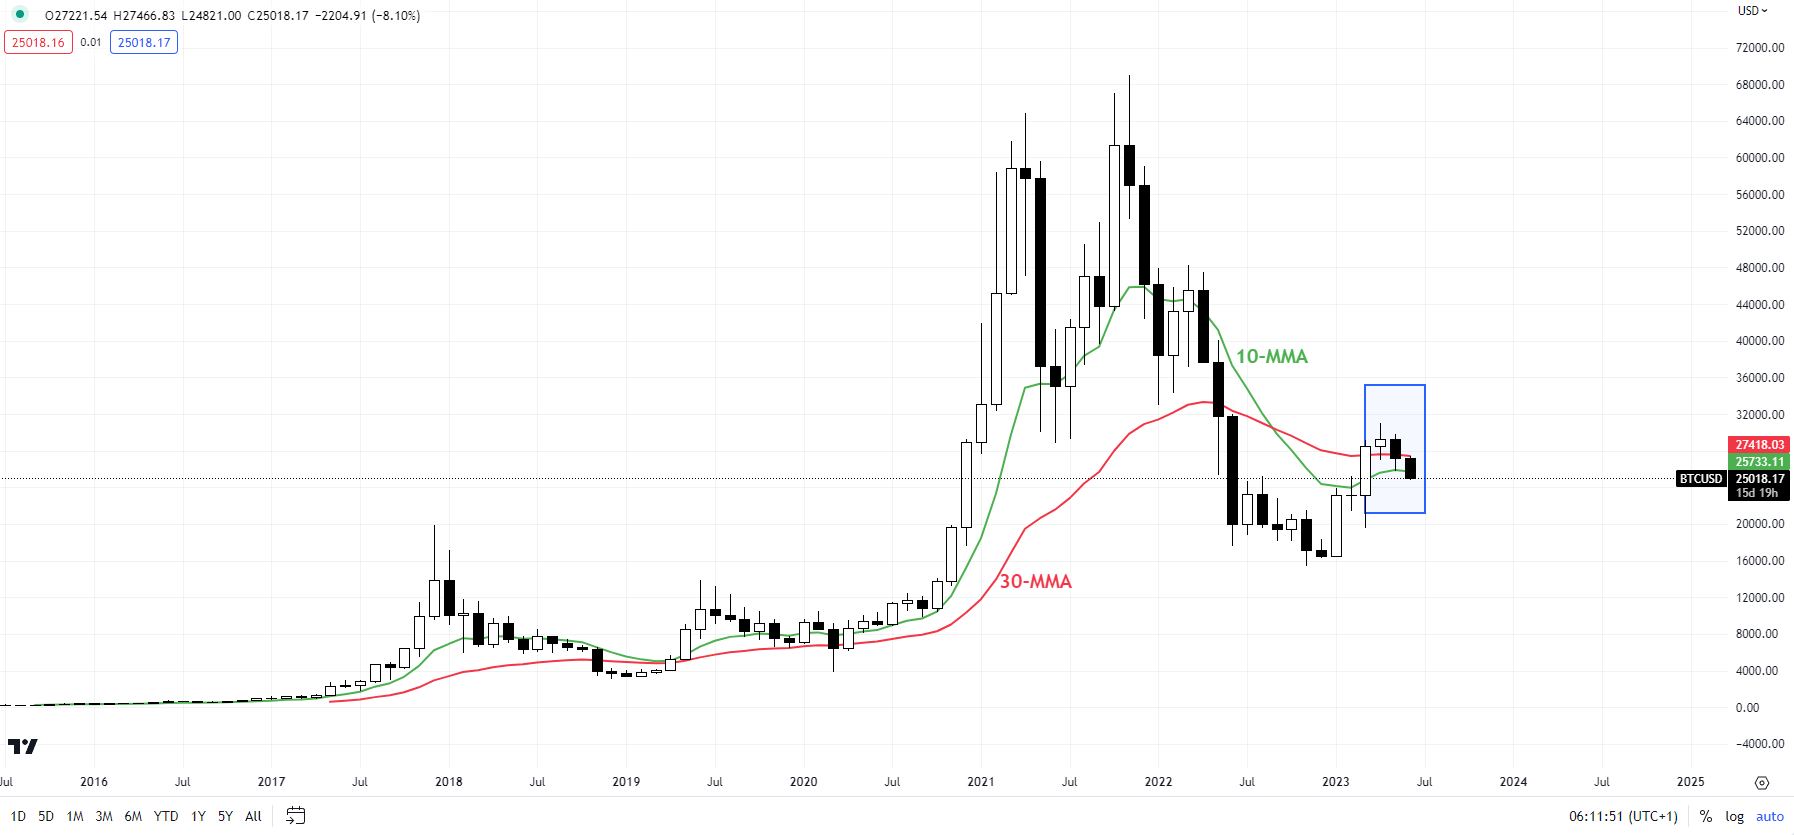
Chart Created by Manish Jaradi Using TradingView
In recent weeks, BTC/USD has struggled to hold above quite strong converged support around 25300-26000 (including the 89-day moving average and February 2023 high). The rebound at the end of May lacked momentum -- see “Bitcoin & Ethereum Week Ahead: Upside Capped for Now?”, published May 30.
ETH/USD Daily Chart
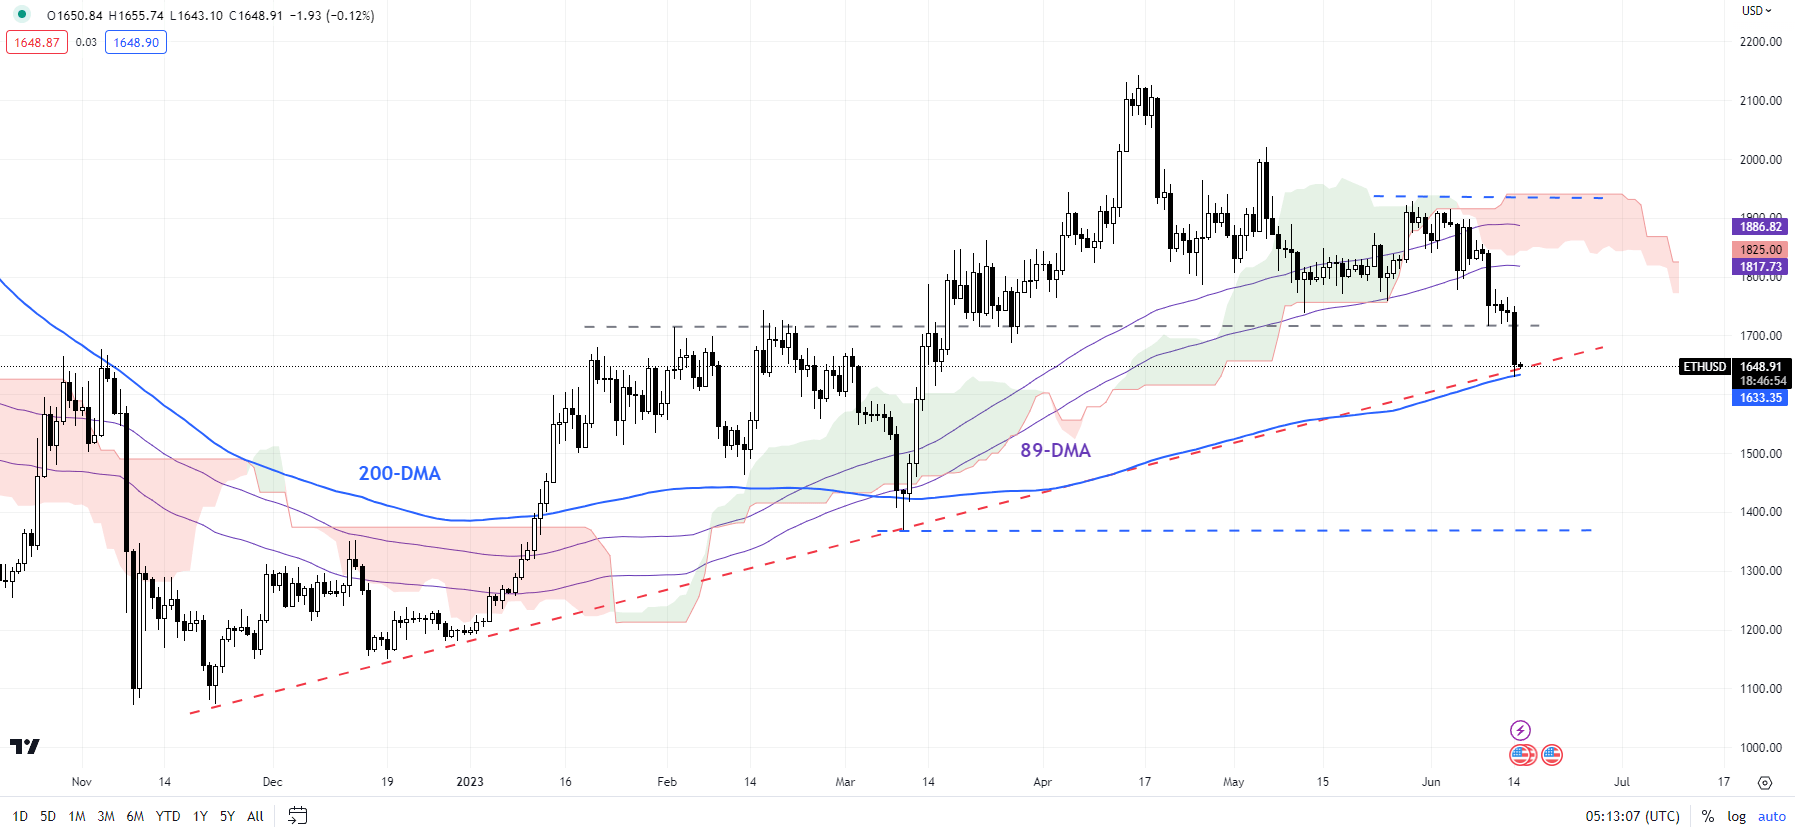
Chart Created by Manish Jaradi Using TradingView
ETHEREUM: Upward pressure has faded
ETH/USD’s failure to reach the May 6 high of 2019 and the subsequent fall below the crucial cushion at the February highs of 1710-1740 (including the 89-day moving average) has confirmed that the bullish pressure has faded. Ethereum is now testing a vital floor on the 200-day moving average (now at 1630). A failure to hold above the long-term moving average could expose the downside toward major support at the March low of 1368.
ETH/USD Monthly Chart
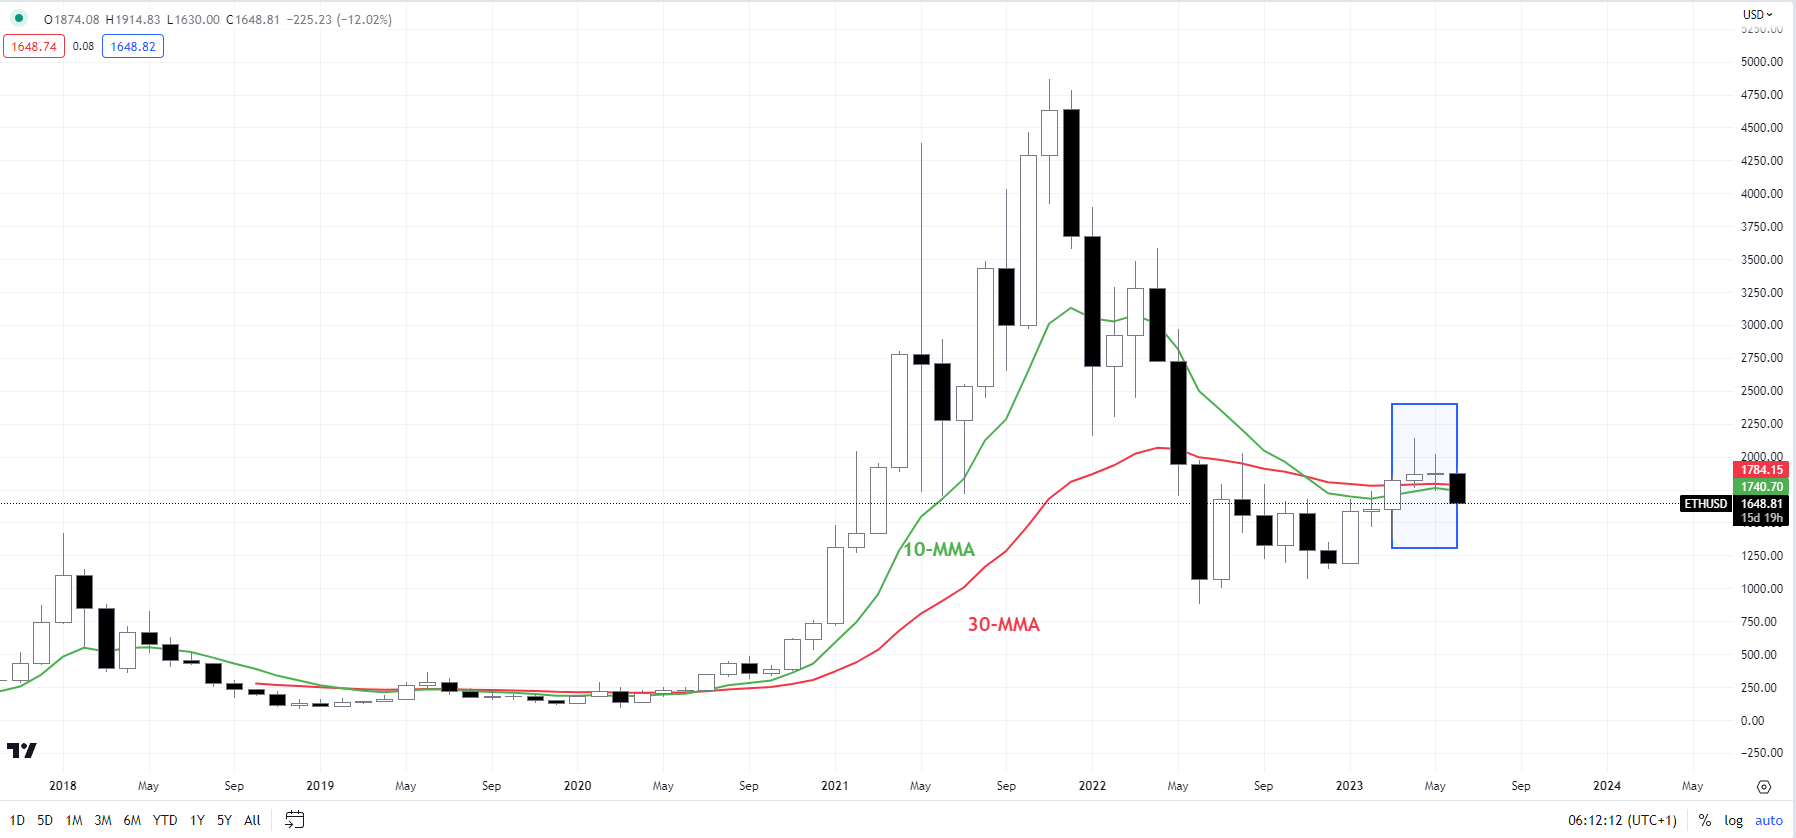
Chart Created by Manish Jaradi Using TradingView
Trade Smarter - Sign up for the DailyFX Newsletter
Receive timely and compelling market commentary from the DailyFX team
--- Written by Manish Jaradi, Strategist for DailyFX.com
--- Contact and follow Jaradi on Twitter: @JaradiManish