


Bitcoin, BTC/USD, Ethereum, ETH/USD - Technical Outlook:
- Bitcoin and Ethereum have essentially been sideways recently.
- The sideway price action appears to be consolidation within the uptrend.
- What are the key levels to watch?

Bitcoin and Ethereum’s rise may have stalled recently, but the uptrend is far from over.
BITCOIN
After hitting a 10-month high in April, Bitcoin’s rally has paused. Attempts to rise past the psychological 30000 mark in recent weeks have been unsuccessful, with the result that BTC/USD looks set to drift lower toward an immediate cushion at the end-March low of 26525. Any break below 26525 could open the door toward 25300-26000 (including the 89-day moving average and February 2023 high).
BTC/USD Daily Chart
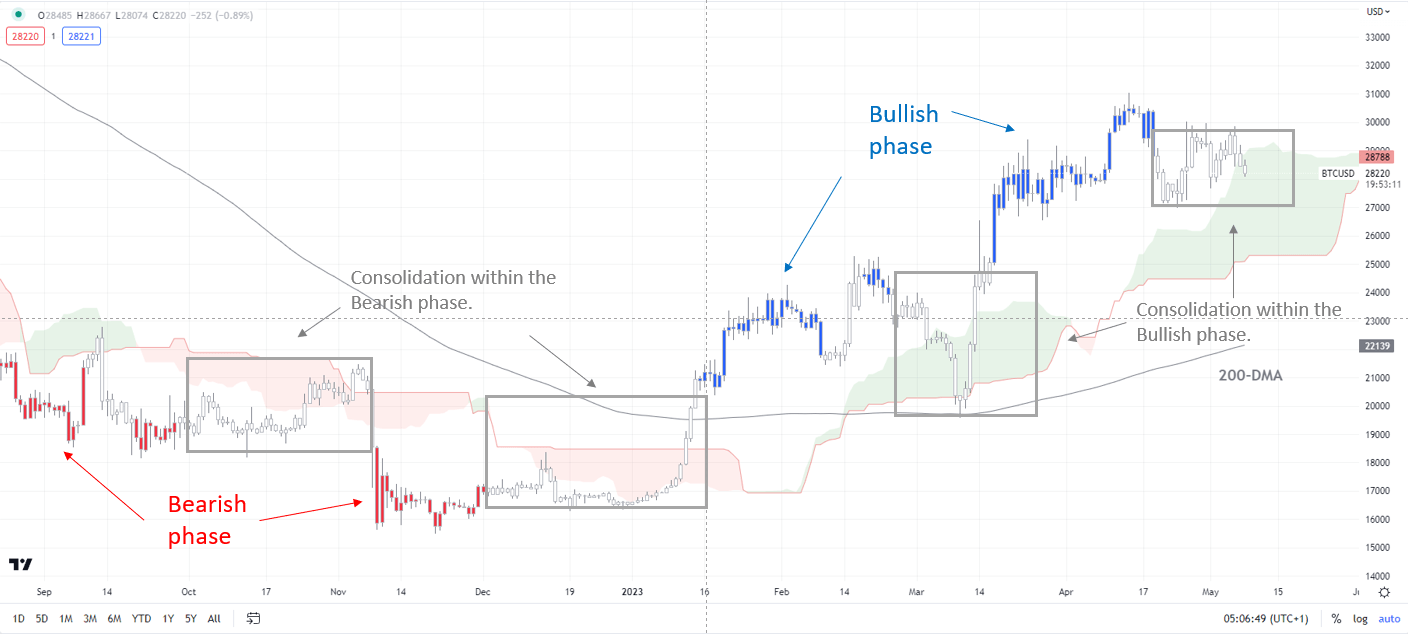
Chart Created by Manish Jaradi Using TradingView
Note: In the above colour-coded chart, Blue candles represent a Bullish phase. Red candles represent a Bearish phase. Grey candles serve as Consolidation phases (within a Bullish or a Bearish phase), but sometimes they tend to form at the end of a trend. Note: Candle colors are not predictive – they merely state what the current trend is. Indeed, the candle color can change in the next bar. False patterns can occur around the 200-period moving average, or around a support/resistance and/or in sideways/choppy market. The author does not guarantee the accuracy of the information. Past performance is not indicative of future performance. Users of the information do so at their own risk.
Earlier last month, BTC/USD retreated from near key resistance area: the May 2022 high of 32375, and an uptrend line from January, coinciding with the 89-week moving average -- a risk highlighted early April. See “Bitcoin Crosses the Key $30000 Mark: Will it Sustain?”, published April 11.
BTC/USD Daily Chart
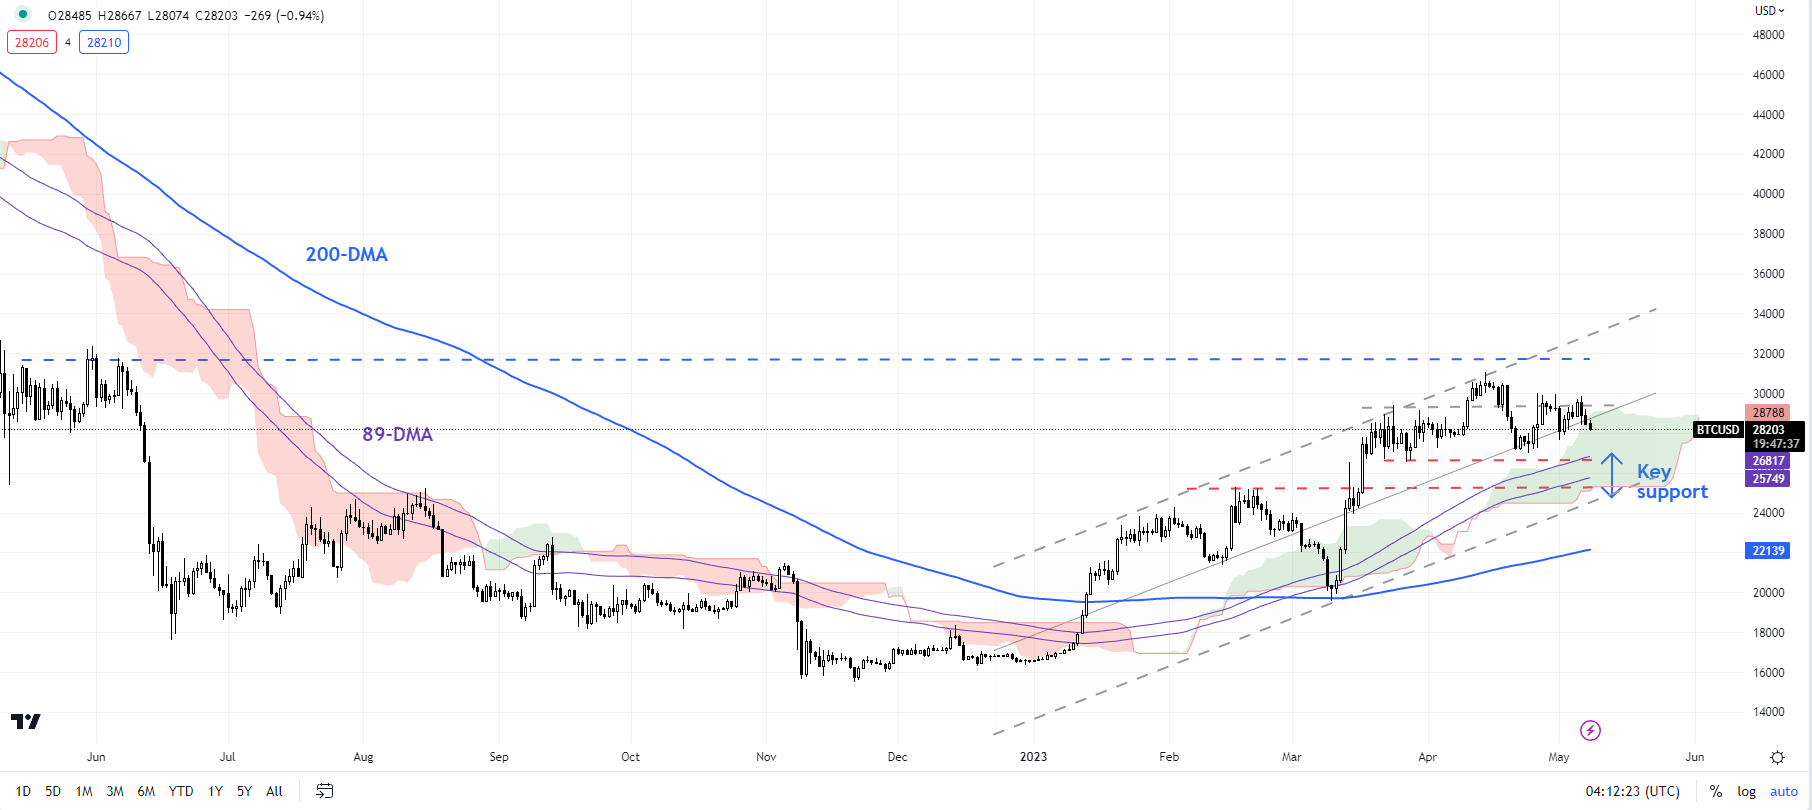
Chart Created by Manish Jaradi Using TradingView
Still, the broader trend remains up on the daily charts – a trend that has been prevalent since January – see “Bitcoin Technical Outlook: BTC/USD Turns Bullish”, published January 18.Having said that, for the uptrend to resume, BTC/USD needs to clear the April high of 31065. Such a break could pave the way toward the January 2022 low of 32950.
ETHEREUM
The failed attempt last week to clear an immediate hurdle at the end-April high of 1965 suggests the balance of risks remains tilted sideways to slightly down for ETH/USD.
ETH/USD Daily Chart
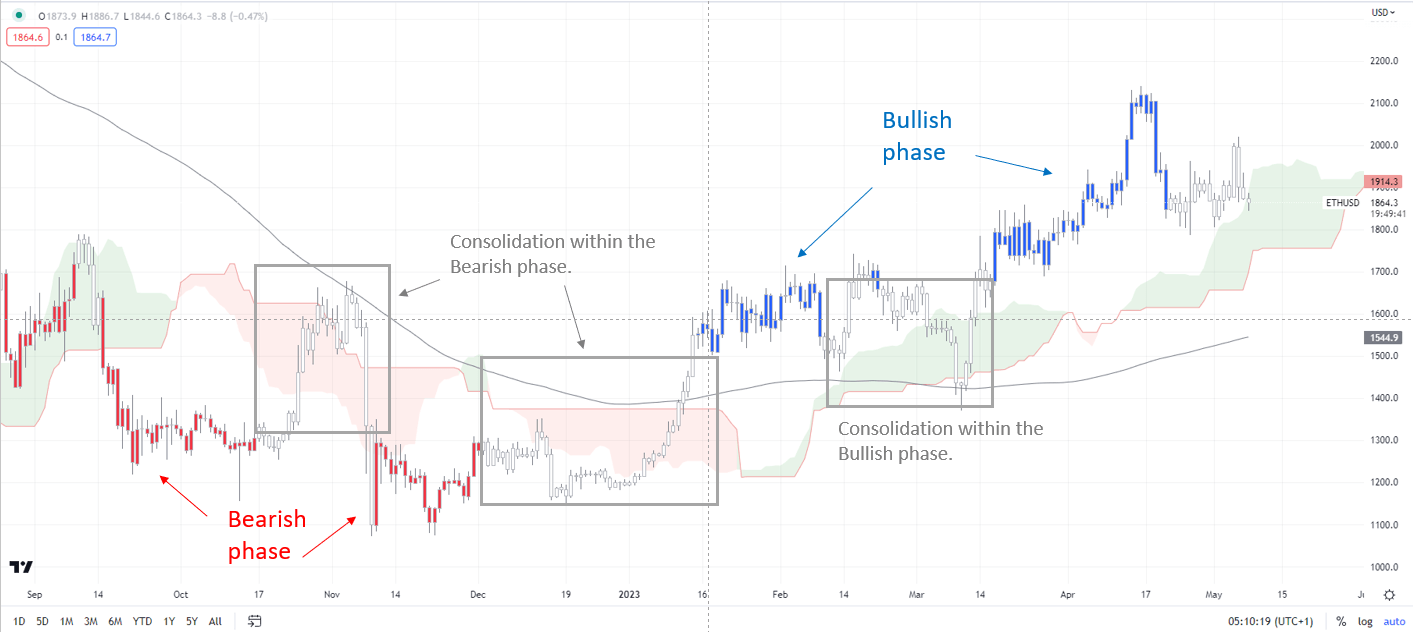
Chart Created by Manish Jaradi Using TradingView
Note: In the above colour-coded chart, Blue candles represent a Bullish phase. Red candles represent a Bearish phase. Grey candles serve as Consolidation phases (within a Bullish or a Bearish phase), but sometimes they tend to form at the end of a trend. Note: Candle colors are not predictive – they merely state what the current trend is. Indeed, the candle color can change in the next bar. False patterns can occur around the 200-period moving average, or around a support/resistance and/or in sideways/choppy market. The author does not guarantee the accuracy of the information. Past performance is not indicative of future performance. Users of the information do so at their own risk.
Ethereum hit a near one-year high last month but failed to clear a tough hurdle on the 89-week moving average, coinciding with the August high of 2030. Immediate support is at the end-April low of 1787. A lower break could expose the downside toward the February highs of 1710-1740.
ETH/USD Daily Chart
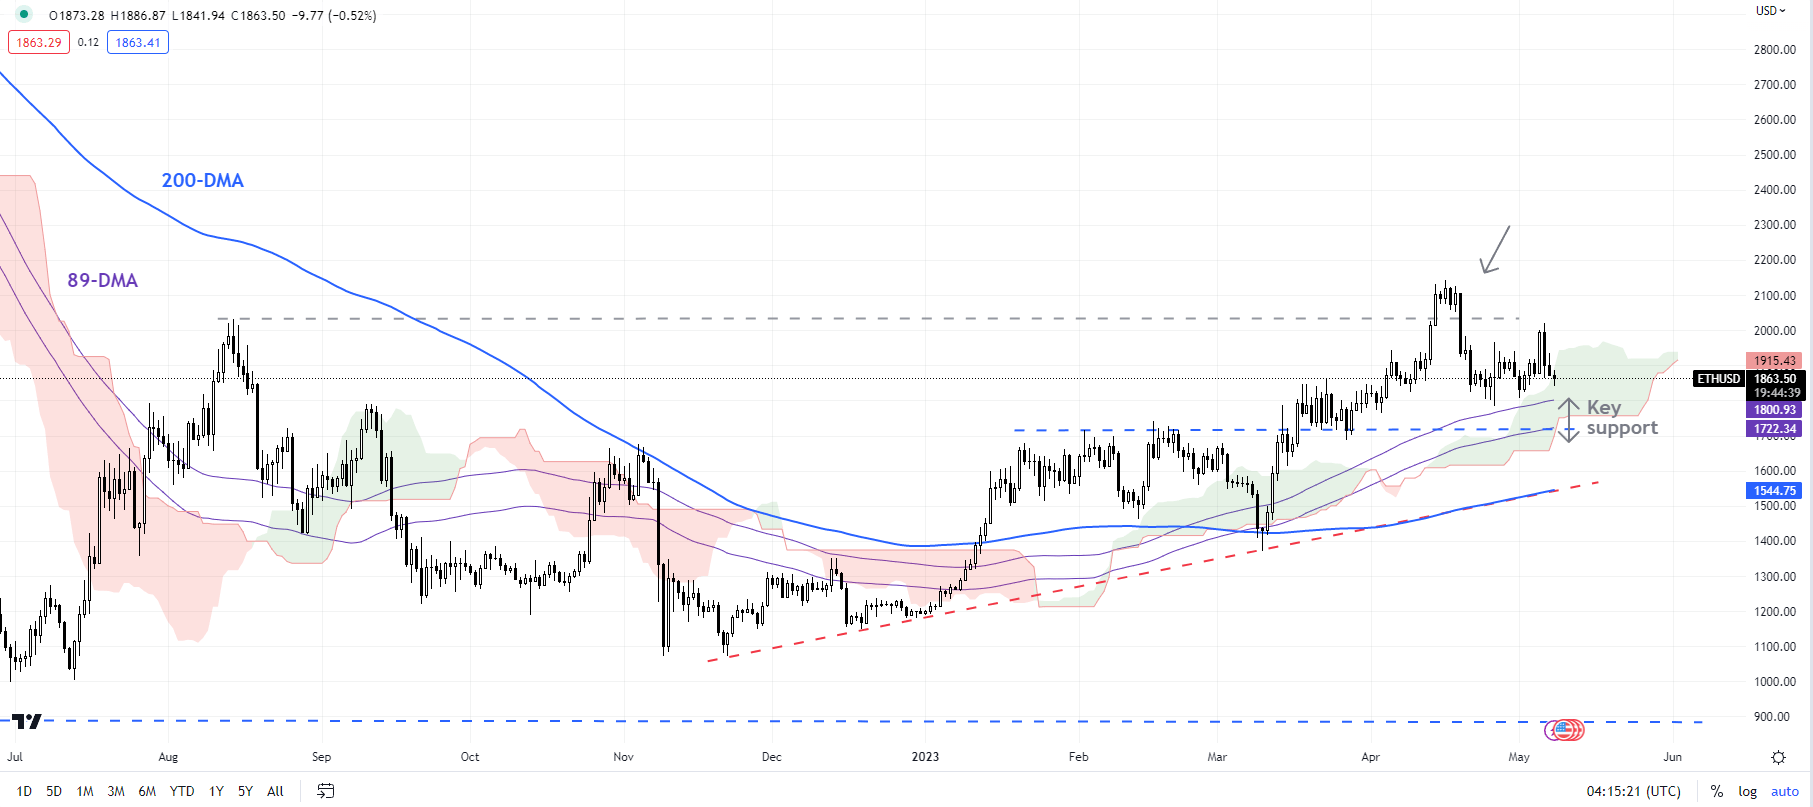
Chart Created by Manish Jaradi Using TradingView
Beyond the short term, the broader trend remains up for ETH/USD, as the colour-coded candlestick charts based on trending/momentum indicators show. A crack above the April high of 2142 could open the way toward 2400 (the 38.2% retracement of the 2021-2022 slide).
Trade Smarter - Sign up for the DailyFX Newsletter
Receive timely and compelling market commentary from the DailyFX team
--- Written by Manish Jaradi, Strategist for DailyFX.com
--- Contact and follow Jaradi on Twitter: @JaradiManish


