

Bitcoin, BTC/USD, Ethereum, ETH/USD - Outlook:
- Bitcoin rally fizzles ahead of a vital hurdle.
- ETH/USD falters at key resistance.
- What is the outlook and what are the key levels to watch?

BITCOIN: Lacks upward momentum
Bitcoin’s inability to retest a vital ceiling at the end-August high of 28150 underscores the broader weakness – BTC/USD just doesn’t have enough upward momentum required to embark on a meaningful uptrend. As a result, the Bitcoin rally last week proved to be short-lived. See the previous update that highlighted the possibility of a rebound “Have Bitcoin & Ethereum Capitulated? BTC/USD & ETH/USD Price Setups,” published September 18.
BTC/USD 240-Minute Chart
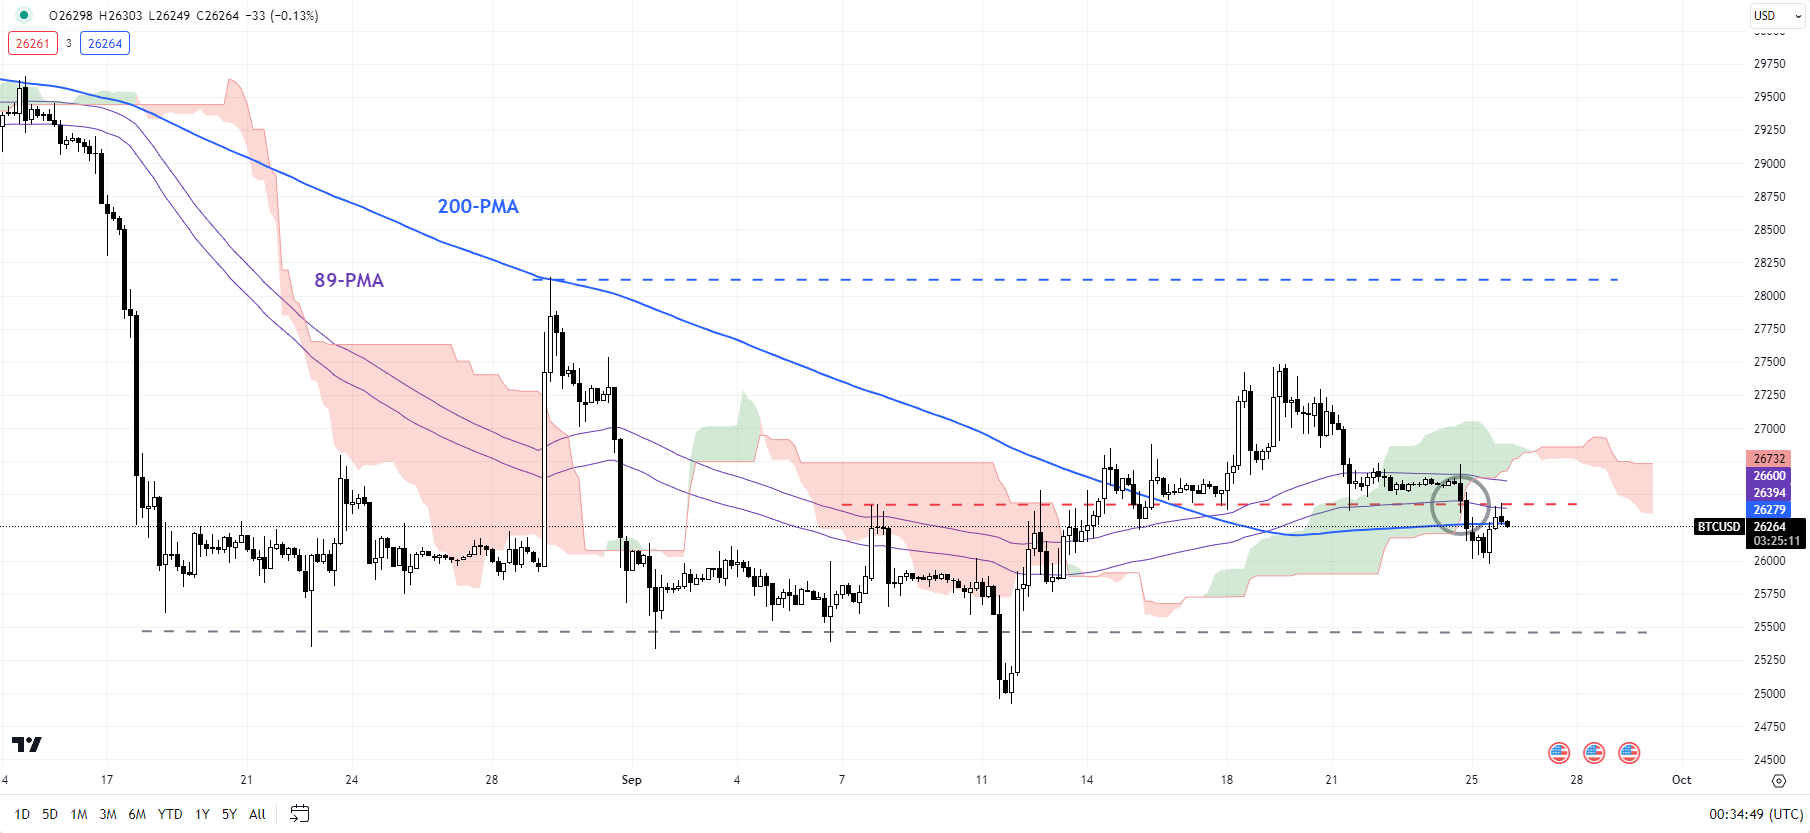
Chart Created by Manish Jaradi Using TradingView
The subsequent fall below crucial converged support at the September 15 low of 26250, coinciding with the lower edge of the Ichimoku cloud and the 89-period moving average on the 240-minute charts confirms that the upward pressure has faded. The break below support has opened up the possibility of two scenarios. BTC/USD could settle in a 24750-27500 range; the second scenario involves a retest of the June low of 24750.
BTC/USD Daily Chart
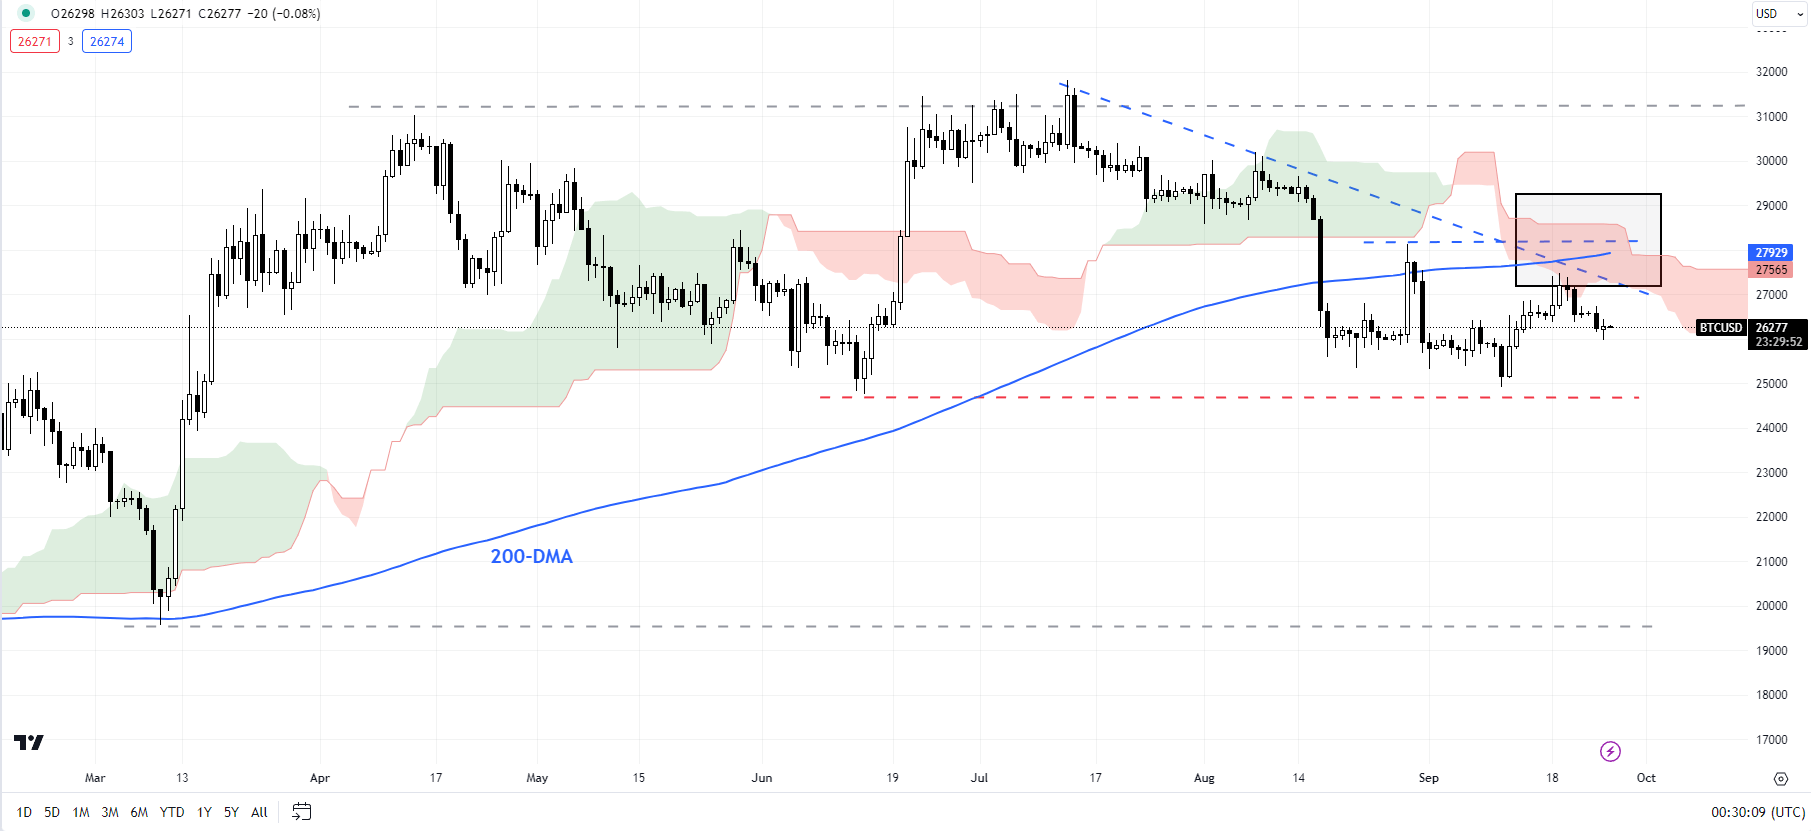
Chart Created by Manish Jaradi Using TradingView
On the upside, unless Bitcoin is able to cross above the end-August high of 28150, the path of least resistance remains sideways to down. From a big-picture perspective, any break below 24750 could spell further weakness toward the March low of 19500.
ETHEREUM: Falters at key resistance
Ethereum charts probably stand out and clarify the inability of Bitcoin to rise toward the August high. Ethereum has succumbed to strong resistance on the 200-period moving average, coinciding with the early-September high of 1660, and a downtrend line from August.
ETH/USD 240-Minute Chart
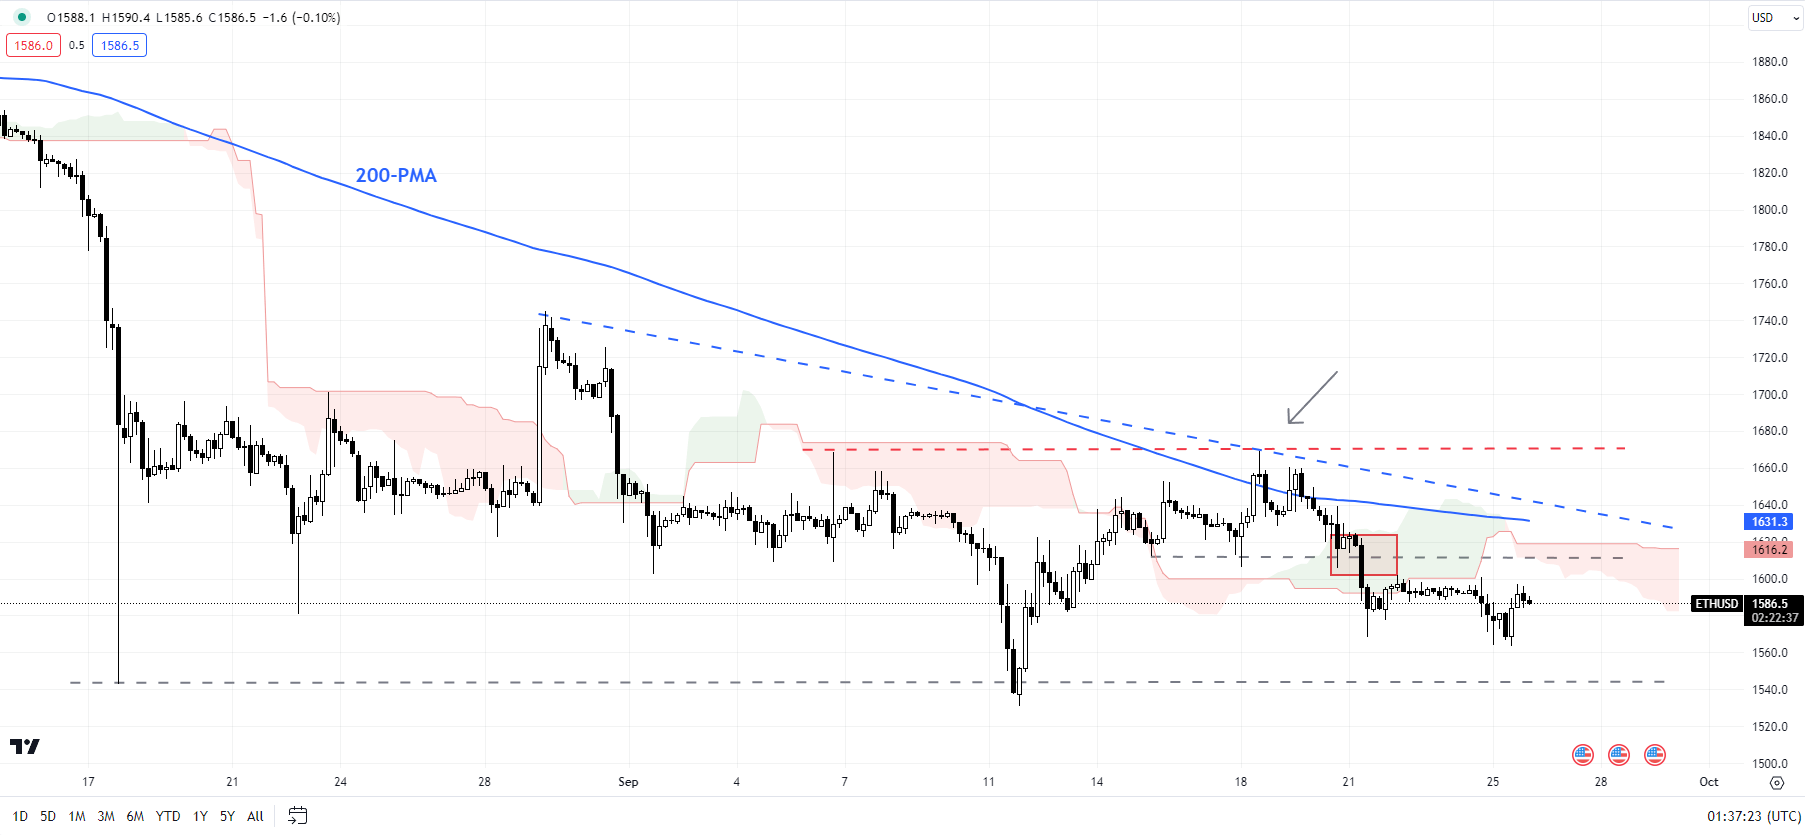
Chart Created by Manish Jaradi Using TradingView
The retreat from key resistance coupled with the subsequent fall below a horizontal trendline support at 1600 keeps the bearish bias intact –as highlighted in the previous update. ETH/USD risks a retest of the August low of 1550. Below the August low, the next support is on the lower edge of a downtrend channel since April (now at about 1485). A break below the 1475-1550 region could pave the way toward the October low of 1370.
ETH/USD Weekly Chart
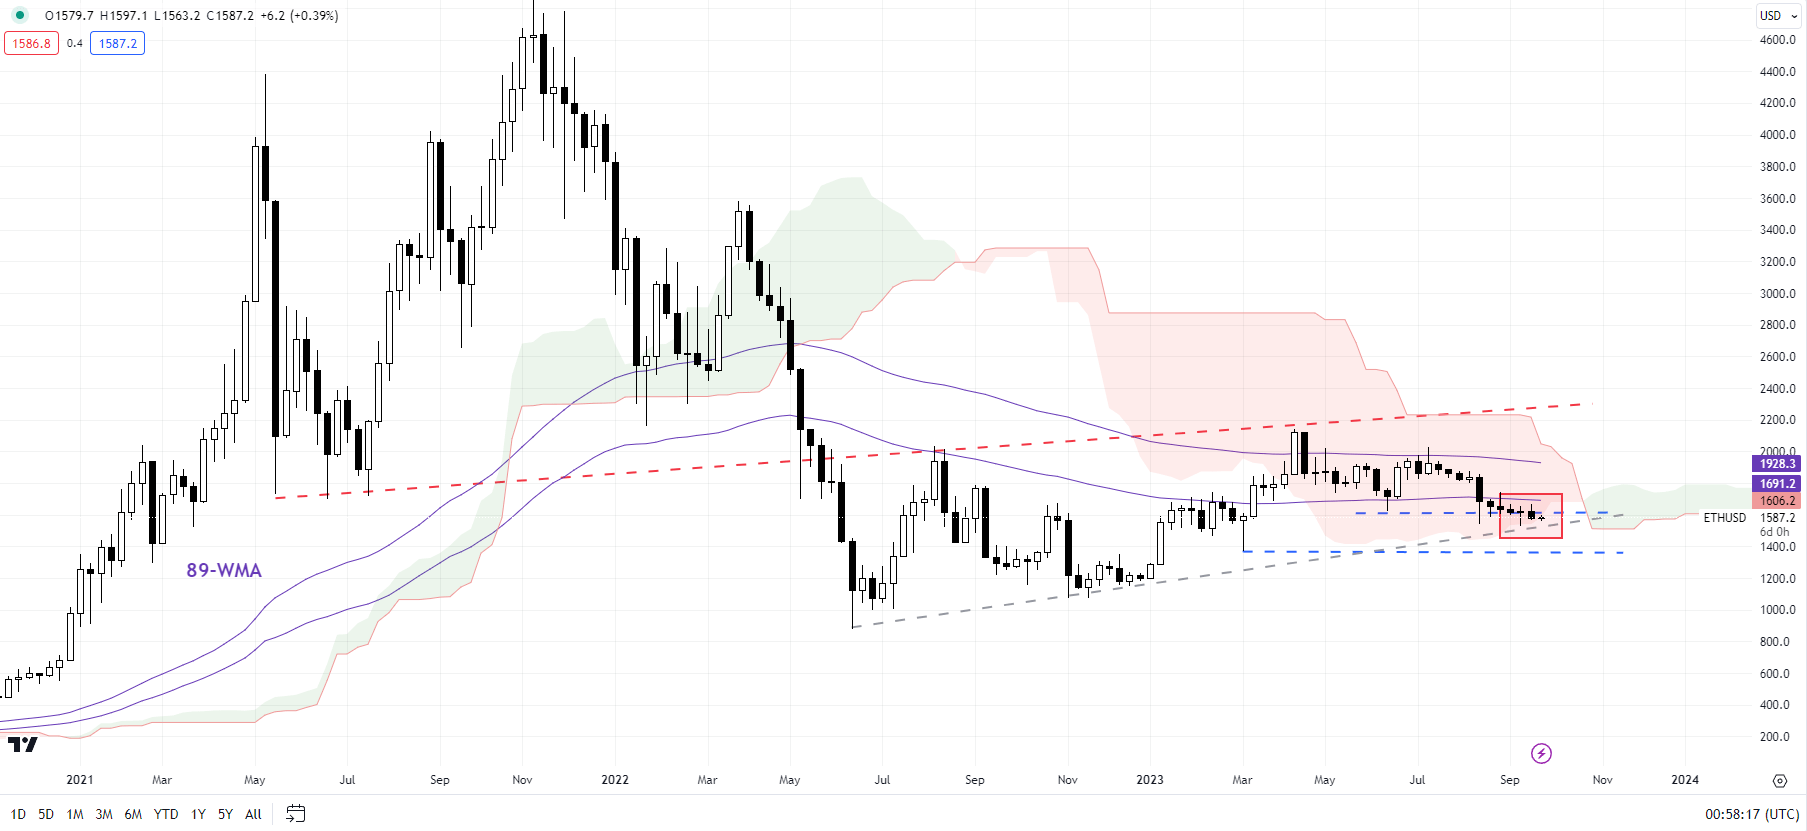
Chart Created by Manish Jaradi Using TradingView
As noted earlier this month, ETH/USD has been under the influence of the bearish Ichimoku cloud cover on the weekly charts. Furthermore, in recent weeks, ETH/USD has been snowed under the Ichimoku cloud on the daily charts. On the upside, Ethereum needs to surpass 1660 at the very least for the downward pressure to begin easing.

--- Written by Manish Jaradi, Strategist for DailyFX.com
--- Contact and follow Jaradi on Twitter: @JaradiManish