


US Dollar Talking Points:
- US rates continue to rally and we’re nearing inversion of the 10 and 30 year Treasury, which hasn’t happened since 2006.
- The US Dollar has surged up to fresh yearly highs, with another boost after the ECB rate decision last Thursday. But, notably, EUR/USD has so far held the low from that meeting and the pair is in a major zone of long-term support. This can keep the door open for pullback themes in the USD while the longer-term look remains decisively bullish.
- The analysis contained in article relies on price action and chart formations. To learn more about price action or chart patterns, check out our DailyFX Education section.

We’re about two weeks away from the next FOMC rate decision and this is a big meeting. The Fed was able to hike by 25 basis points in March while avoiding the topic of QT, kicking the can to their next rate decision in May. Many are expecting to hear some type of clarity about what the FOMC will do with the $8 trillion portfolio that’s amassed after an aggressive two-year outlay of QE; and the Fed is expected to hike by 50 basis points at that meeting with a current probability of 91% for such a move.
If the Fed only goes 25 basis points at that rate decision, there will be extreme disappointment and perhaps even a bearish signal as markets begin to wonder what the Fed is so afraid of. This would likely be temporary, however, and we’d probably see another March-like response where stocks ramp shortly after. But, this would also do little to address the massive inflation that continues to show across the American economy with last month’s CPI setting yet another fresh 40-year high.
This explains why expectations are so incredibly stretched right now, with the median expectation for another nine rate hikes in the final nine months of this year. What happens to mortgage rates in that backdrop? And in response, what happens to home prices, which most Americans have much of their wealth tied into? And there’ve already been massive spikes to food prices and the President has even warned of a ‘global food crisis’ this year – begging the question – how do emerging markets deal with this surging USD and higher rate backdrop?
And then, of course, the stock market. The Fed put appears to be cast away at this point but will the Fed re-engage with that at any point? Or would they keep hiking into a recession when stocks have pushed into bear market territory?

It does seem, more and more, like the theory from Credit Suisse Strategist Zoltan Pozsar is gaining traction. Pozsar posited in February that the Fed needs asset prices to come down so that they can hike enough to stem inflation, without causing a recession along the way. On the heels of that research Minneapolis Fed President Neel Kashkari went so far as to say that the Fed is trying to ‘engineer a soft landing.’
So, at this point it’s starting to feel like the long side of stocks is fighting the Fed. And in response rates are rallying and the US Dollar is along for the ride as we near the first of what’s expected to be a series of meetings with 50 basis point rate hikes. Stocks seem vulnerable here and that’s why I choose that as my Top Trade for Q2, focusing in on the bearish side of US equities.
In the US Dollar, the concern is buying a top as the currency is trading above an already bullish trend channel, and this can be spanned across counterparts such as EUR/USD which I’ll look at in a moment.
US Dollar Weekly Price Chart
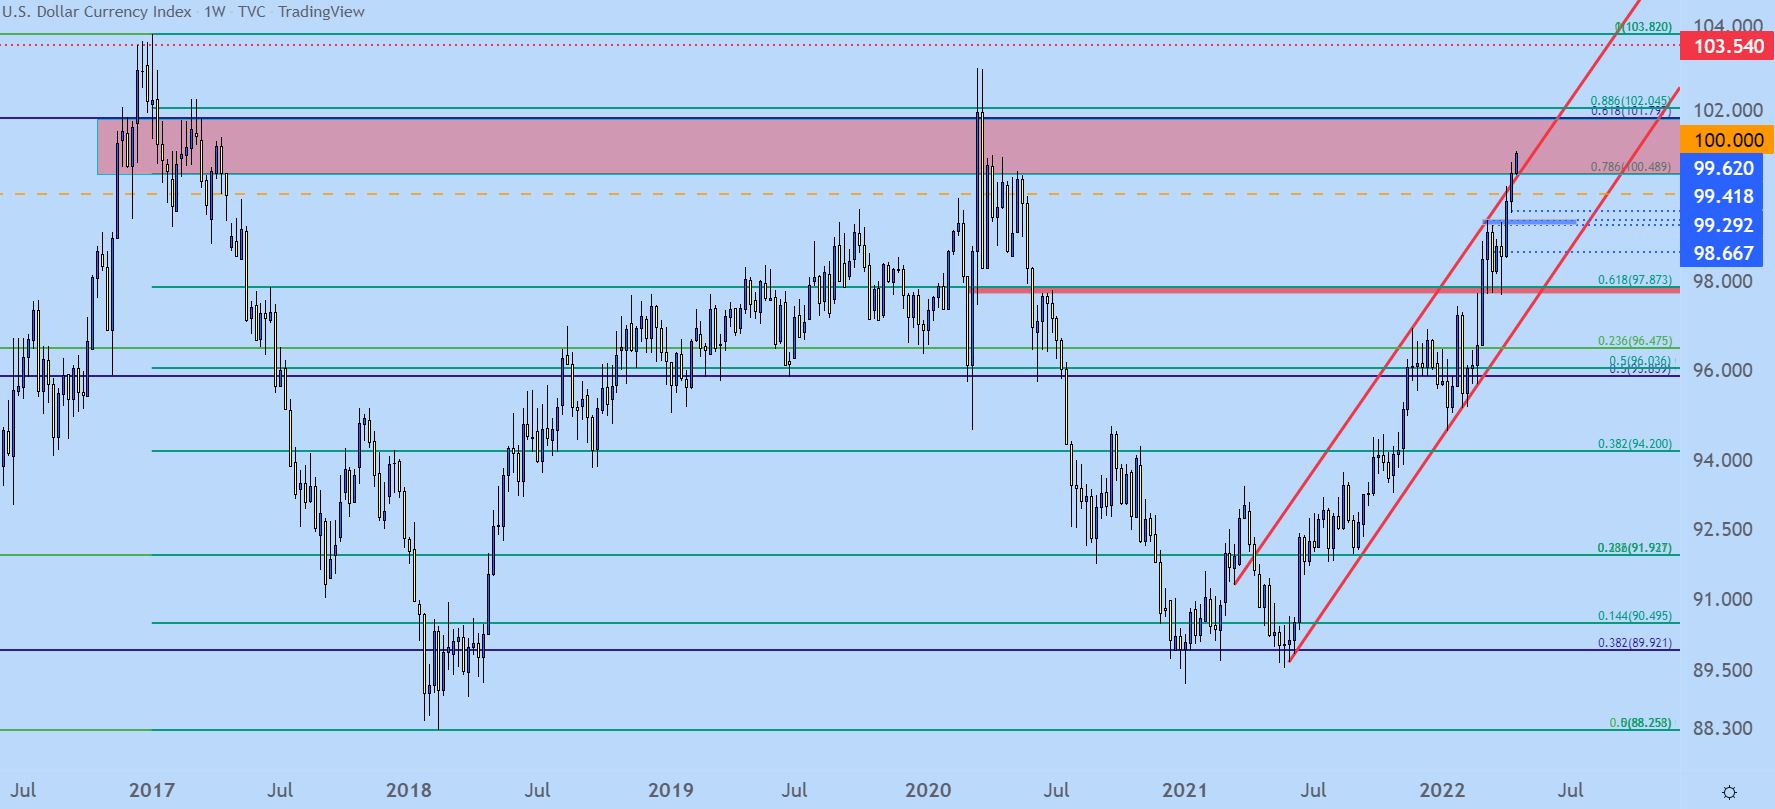
Chart prepared by James Stanley; USD, DXY on Tradingview
EUR/USD
The other side of that argument in the US Dollar boils back to counterparts. If we’re going to see the Dollar continue to gain then we’re going to need to see another currency that’s in the DXY quote to depreciate, and given the incredibly high allocation of the Euro to that DXY price, it’s unlikely that the USD does anything that the EUR/USD doesn’t at least partially support.
And as USD is running into long-term resistance, EUR/USD has started to tangle with a big spot of long-term support. This is a zone that’s been in-play for almost eight years now.
EUR/USD Monthly Price Chart

Chart prepared by James Stanley; EURUSD on Tradingview
EUR/USD Shorter-Term
That big zone came into play after ECB last week when the bank took on a familiar dovish tone. EUR/USD put in a fast and aggressive fall, piercing the 1.0800 level for the first time since the pandemic was getting priced in. That low from last Thursday has since held, and the fact that sellers haven’t been able to develop any further drive highlights pullback potential, and this can be extrapolated into the US Dollar, as well.
EUR/USD Daily Price Chart

Chart prepared by James Stanley; EURUSD on Tradingview
GBP/USD Triangle or Wedge
I think a good analyst can see both sides of a trade. A good trader knows how to attack it and work with the move in terms of the bigger picture.
In GBP/USD, I merely want to present both sides so readers and viewers can make up their own minds. The fact is that the 1.3000 level has been holding the lows and this is a major psychological level that’s been drawing buyers in for some time now, to the point where there’s even been some slight penetration of that level although no daily closes as of yet.
But, buyers haven’t exactly been able to do much with this yet, as indicated by the bearish trendline sitting atop price action. This, when added with horizontal support at the 1.3000 handle, makes for a descending triangle which is approached with the aim of bearish breakdowns.

GBP/USD Daily Price Chart
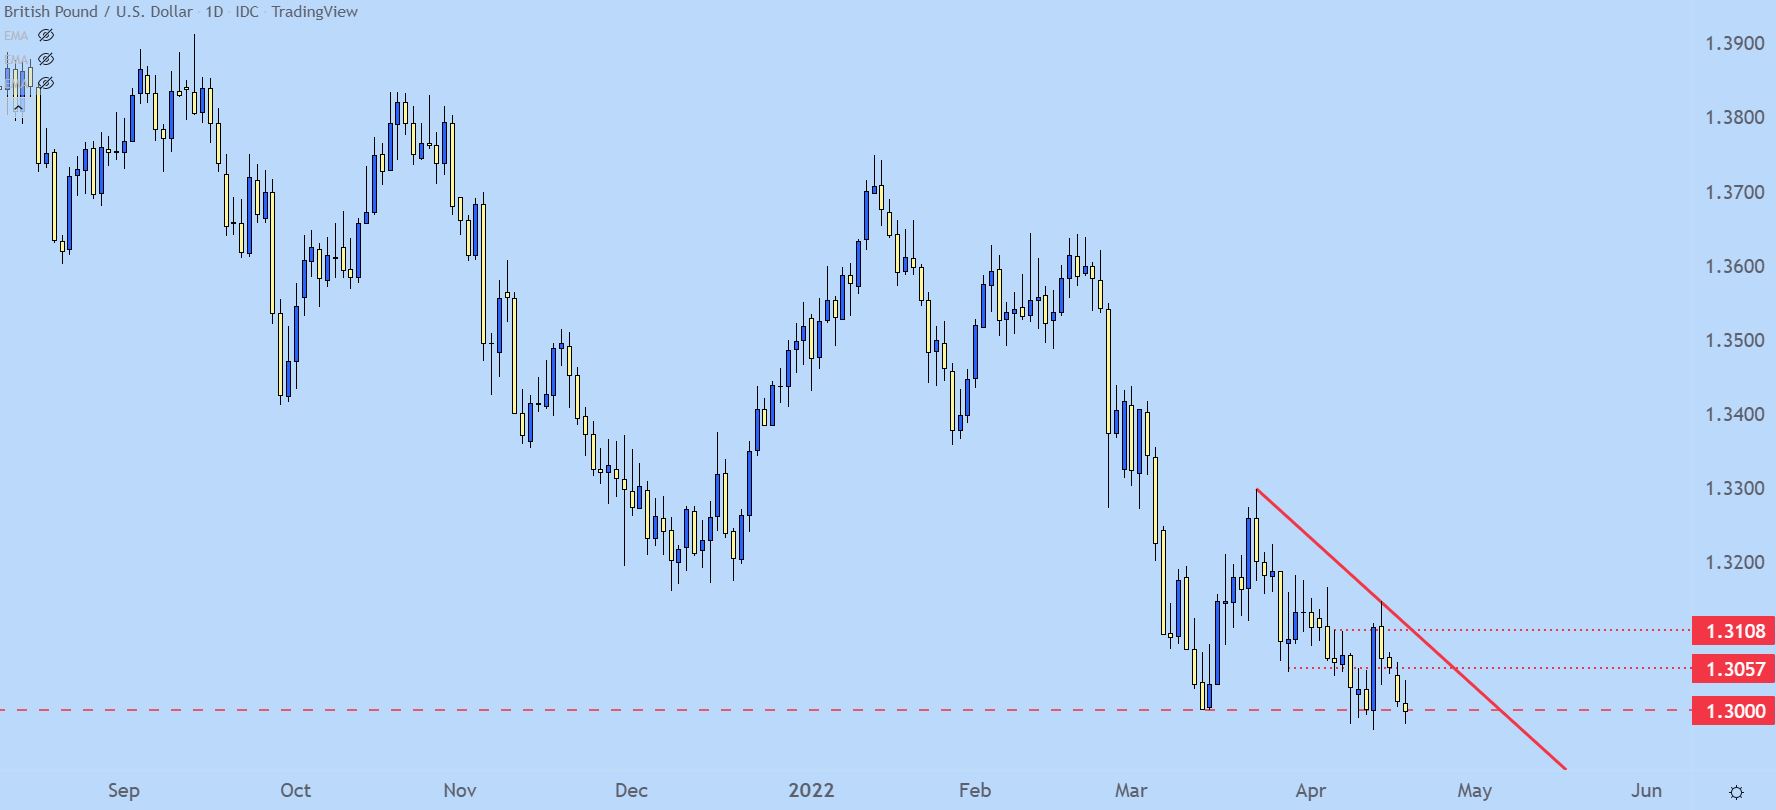
Chart prepared by James Stanley; GBPUSD on Tradingview
The other side…
If you draw a trendline on the wicks of the lows, you’ll notice a weaker angle than what shows at resistance and this makes for a falling wedge, based off of the 1.3000 big figure. This formation is often approached in the opposite manner of the above, with traders looking for bullish reversals as sellers are continually stymied around support while remaining vigorously bearish around resistance or at highs. This is a deductive setup but, remains of interest here in GBP/USD and, if we do see a pullback in the USD from these long-term resistance levels, we could have the makings of a short-term reversal to work with.
GBP/USD Daily Price Chart

Chart prepared by James Stanley; GBPUSD on Tradingview
--- Written by James Stanley, Senior Strategist for DailyFX.com
Contact and follow James on Twitter: @JStanleyFX


